Following our comments on the open debate from the researchers behind the memo “Facts about Nuclear Power,” here are our comments. We hope the researchers find our comments useful for a more fact-based and transparent debate.
On Thursday, 20 October, a paper entitled “Facts about nuclear power in Denmark – Input to a fact-based discussion of the advantages and disadvantages of nuclear power as part of the green transition in Denmark” was published. A group of 16 Danish researchers from five universities are signatories to the memorandum.
The association Atomkraft Ja Tak welcomes the note in the debate. It is fantastic that we are now debating nuclear power. It is also gratifying that the researchers have openly set out to get inputs to prepare a version 2.0 of the note. We at Foreningen Atomkraft Ja Tak have plenty of them, which we will review in this article. However, we believe that it is particularly relevant that the Danish researchers who know the most about nuclear power and who, remarkably enough, have not been included in this version, are included in the next version of the memorandum. You should also involve foreign experts, for example from Sweden, where nuclear power faces a significant expansion in the coming years.
The Danish researcher, Bent Lauritzen, who is section leader for Radiation Physics at DTU, has spoken to the media “Ingeniøren” highly critical of the note. His reaction is, among other things:
“They seem to have not understood the technology. I don’t want to assess whether you should have nuclear power in Denmark, but you should at least investigate it seriously, and I don’t think this is.” [1]
It is important to point out that only some researchers behind the memo are trained with a specialty or additional competence profile in implementing nuclear power. We find, among others, Henrik Lund among the researchers known for his past in the anti-nuclear movement OOA, which organized nuclear marches in the 70s and 80s. Henrik Lund is also one of the central figures behind the energy system model used in the memo. Henrik Lund told DR a few years ago:
For me, nuclear power is not a dream. It’s a nightmare. My dream is renewable energy.” [2].
While the researchers do not appear to have educational competence in implementing nuclear power in energy systems, their area of competence is primarily 100% renewable energy systems, in which nuclear power is not included. It is therefore important to bear in mind that the researchers behind the report do not necessarily have sufficient expertise to make an adequate “Input to the debate on nuclear power.”
In the foreword to the note, the researchers write: However, it is difficult to directly compare solar, wind, and nuclear power. This formulation creates an expectation that researchers will try to make the best basis for comparison between the energy sources. However, this turns out not to be the case.
In the first and primary section of the memo entitled “Costs and construction times for nuclear power in Denmark,” they compare three selected nuclear power plants with three wind farms and one solar park in Denmark. Such a one-to-one comparison between price and construction time for solar/wind and nuclear power is not meaningful for many reasons, which we will review.
In the second section of the paper, “Energy systems,” the researchers then try to consider the lack of a basis for comparison in the first section by incorporating nuclear power into one selected model from IDA’s climate response 2045. However, the input used in this section comes from the first part of the note.
Foreningen Atomkraft Ja Tak wrote the present post. We are a cross-party grassroots movement that wants to contribute to a factual and informed debate on nuclear power as part of the solution to society’s energy and climate challenge.
Although the name might suggest otherwise, the association wants a technology-neutral approach to the energy and climate challenges, and we are thus not against the expansion of either wind turbines or solar cells. However, we do not think the general public debate on nuclear power is an expression of a technology-neutral approach to the energy source. This is also evident in the memo, which lacks so many nuances that it actually expresses the opposite of the input to a fact-based debate on nuclear power in Denmark that the researchers say they want to bring.
For clarifications or other inquiries, please contact Johan Christian Sollid, chairman of the Atomic Energy Association Yes Please.
Johansollid@atomjatak.dk
Table of contents
Key points
Introduction
1. Costs and construction times of nuclear power in Denmark
1.1 Electricity generation costs
1.2 Construction times
1.3 Support needs for investment in nuclear and renewable energy
1.4 Nuclear power as peak and reserve load
1.5 Small modular reactors
2. Energy system analysis
3. Remaining issues
3.1 Where in Denmark should such nuclear power plants be located
3.2 Risk Placement
3.3 How radioactive waste is managed and where should it be deposited
4.Sources
Key points:
- The researchers behind the paper select three of the most expensive and delayed nuclear power projects to represent European nuclear power. The researchers failed to address why the projects were so expensive and delayed.
- The absence of nuclear power plants in other countries (Japan or South Korea) is not explained.
- According to the International Energy Agency, the price of both wind and solar energy has risen over the past few years, especially due to the rising raw material prices, which have a major impact on the construction price of material-intensive energy sources such as wind and solar energy.
- The researchers believe that we cannot compare with nuclear power in China due to other working conditions, but do not seem to relate to the fact that 1/5 of all solar cells installed in Denmark can be traced back to slave labor in the Chinese province of Xinjiang.
- The researchers do not address whether nuclear power can supply district heating in a Danish context or cost reductions in connection with the establishment of already existing CHP plants.
- A direct comparison between controllable (nuclear) and non-controllable (wind and solar) energy sources is misleading. International Energy advises against such a comparison, as non-controllable energy introduces several systemic costs that are not equally associated with controllable energy sources.
- Misleading comparison of construction time. The researchers compare b.la., a small onshore wind farm, with a large nuclear power plant in England, which produces 150 times more electricity per year than the wind farm. Here, the researchers should consider the capacity factor and the installed capacity at the plants.
- The researchers misrepresent the planning time of wind farms in Denmark by not including previous studies and consultations in their estimates. In the case of nuclear power, the planning times are considerably more accurate.
- The researchers’ systems analysis is based on objectionable assumptions about the investment costs of nuclear power. The underlying assumptions of IDA’s climate response 2045 have also been included, based on ambitious assumptions for a future energy system.
- The researchers touch on the remaining questions regarding safety risk and waste management. Here we find the researchers’ criticisms incredibly unnuanced and lacking documentation.
Introduction
Initially, it is essential to clarify that scientists make some significant mistakes that make their later conclusion, that nuclear power is far too expensive and slow in a Danish context misleading. To compare the price and construction time of energy sources, the researchers select three of the most costly and delayed nuclear power plants in world history: Olkiluoto 3 in Finland, Flamanville 3 in France, and Hinkley Point C in the United Kingdom, thus defining these as representative of nuclear technology. The researchers failed to address why the projects were so expensive and delayed. The reason is that the countries opted for an untested reactor design that was not even fully designed when construction began. However, the vast majority of nuclear power plants in the world, including those built in the last 20 years, have been built at competitive prices and much faster than the three selected nuclear power plants.
The researchers compare the price and construction time of the three above-mentioned nuclear power plants one-to-one with the price and construction time of the last two Danish offshore wind farms, an onshore wind farm and a solar farm, without taking into account that the nuclear power plants and the weather-based energy sources supply two very different products in the form respectively. Controllable and fluctuating energy production. Since energy sources provide two other products, it is not accurate to compare their price and construction time one-to-one.
The memo paints a picture of nuclear power being far too expensive in a Danish context. One may therefore wonder why our neighboring countries, Sweden and the Netherlands, with whom we often compare ourselves and which have access to the same data basis, have plans to expand nuclear power in conjunction with an expansion of wind and solar.
1- Costs and construction times of nuclear power in Denmark
It quickly becomes clear that the researchers intend to compare the only three nuclear power plants built in Europe in the last 15 years with offshore wind and solar energy expansion. The 60 other reactors that have been built around the world during the same period are left out by the researchers. Why don’t they compare with reactors constructed in South Korea, Japan, or the UAE? It is not self-evident to compare exclusively with the works built in European countries over the last two decades.
The researchers defend this choice because nuclear power plants in China and India do not face the exact safety requirements as in Western Europe, but they fail to demonstrate evidence for this assumption. The fact is that some of the Chinese nuclear power plants are built by the French company EDF in an entirely identical reactor design. How scientists arrive at the opposite is nowhere to be seen. Although they refer to a source, it states the following:
“While significant cultural, social, and political differences may exist between countries, the fundamental basis for assessing the safety of nuclear reactors is fairly uniform among countries with established nuclear power programs.” [3]
It is also noteworthy that in their selection of the three European reactors mentioned, the researchers only address the opt-out of reactors in China and India. Over the last 20 years, nuclear power plants have also been built in Japan and South Korea, which are pretty comparable to European countries. Both countries are prosperous, high-tech, and democratic countries considered part of the West. We find no further explanation for excluding these countries in the relevant note. Both countries have recently announced that they will invest in nuclear power as a significant part of their green transition.
Price trends
Contrary to the researchers’ skepticism about future costs for nuclear power, they are pretty uncritical about how costs for wind and solar energy will develop. They insinuate that prices will probably continue to fall because wind and solar costs have fallen in recent decades. Of course, it would be good if this happened, but one must be careful with such assumptions, and several factors indicate that it is challenging to push prices further down.
On the contrary, according to the International Energy Agency, the price of both wind and solar energy has risen in the last few years [4], mainly due to the rising raw material prices, which have a major impact on the construction price of material-intensive energy sources such as wind and solar Energy.
There have been calls from the wind industry [5] that profits are under pressure [6] and that parts of the supply chain are threatened with survival [7]. Vestas and Siemens Gamesa have laid off hundreds of employees this year alone, including in Denmark [8].
However, the most crucial criticism regarding the researchers’ expectations of the price of renewable Energy is that they do not address the fact that a very significant reason for the hefty price drop of the last two decades, especially for solar cells [9], is that a very substantial reason for the big price drop of the previous two decades, especially for solar cells [9], has been China’s massive entry into the production of the required raw materials and components.
Chinese production takes place in many cases under deeply objectionable conditions that we would never accept in the West and are now increasingly being problematized politically [10]. In short, the low production price for solar cells has been possible due to the use of cheap Chinese coal for energy-intensive solar cell production, and not least by using ultra-cheap forced labor from the Muslim minority in China. As much as 45% of the world’s production of the main component polysilicon of solar cells is produced in these labor camps [11].
If we look at solar parks set up in Denmark, TV2, and Danwatch revealed in July that up to 1/5 of all Danish solar cells have components that can be traced back to forced labor in China. The solar park Heartland, which is the solar park the researchers have selected to compare prices with nuclear power, has been built by the solar company Better Energy. TV2 writes the following about the solar park Heartland:
“The cells in the wind farm were supplied by a Chinese solar cell manufacturer Risen Energy, which has subcontractors in Xinjiang who use the Chinese work programs. The solar company, Better Energy, has built the park.” [12].
We, therefore, find it extremely strange that scientists write that we cannot compare with nuclear power plants built in China because “… they are based on different construction and safety requirements than those in Western Europe.” But when it comes to Danish solar parks, are similar considerations not included?
If it is politically decided to do something about the above problems, it will undoubtedly be quite a challenge to live up to the expectation that even cheaper solar cells will be produced in the future. The solar industry has also tried to pressure the EU to limit possible strict legislation against the purchase of goods produced by forced labor.
The European trade association, Solar Power Europe, is skeptical that such a political decision can be implemented. The following is an excerpt from an article on Danwatch:
“As a justification, Solar Power Europe emphasizes, among other things, that the import ban must not impose an excessive administrative burden on companies and that “the EU is currently completely dependent” on imports from China and Southeast Asia in its efforts to implement the green transition” [13].
It is not only nuances regarding the price of renewable energy that needs to be added to the memo. There needs to be more nuance to the cost of nuclear power, which we will now touch. The researchers do not include opportunities to improve the economy of nuclear power plants.
Cheaper reactor types than EPR
Firstly, there is no mention of the possibility of choosing suppliers and reactor types other than the French/German-designed EPR reactor supplied by the French EDF. This would otherwise be a very relevant consideration, given that the first three in Europe are not going well and that there are cheaper alternatives on the global market.
In Poland, the government has just concluded agreements with two other companies, the American company Westinghouse and the South Korean company “Korea Hydro & Nuclear Power,” for these companies to build nuclear power plants in Poland [14]. Poland also received offers from French EDF, which, however, would reportedly be over 50% as expensive a choice for Poles as the Korean model [15].
This is only regarding choosing a classic large, conventional nuclear power plant. We will later consider the possibility of investing in so-called small modular reactors.
First-of-a-kind (FOAK)
It is known in the literature that specialization gains from building several units of the same reactor type contribute to pushing down the price. The type of reactor built in Finland, England, and France can be described as the First of a kind (FOAK). The International Energy Agency (IEA) points out in their latest price report that significant gains will be made by continuing to build the same reactor type several times, also called Nth of a kind (NOAK) [16].
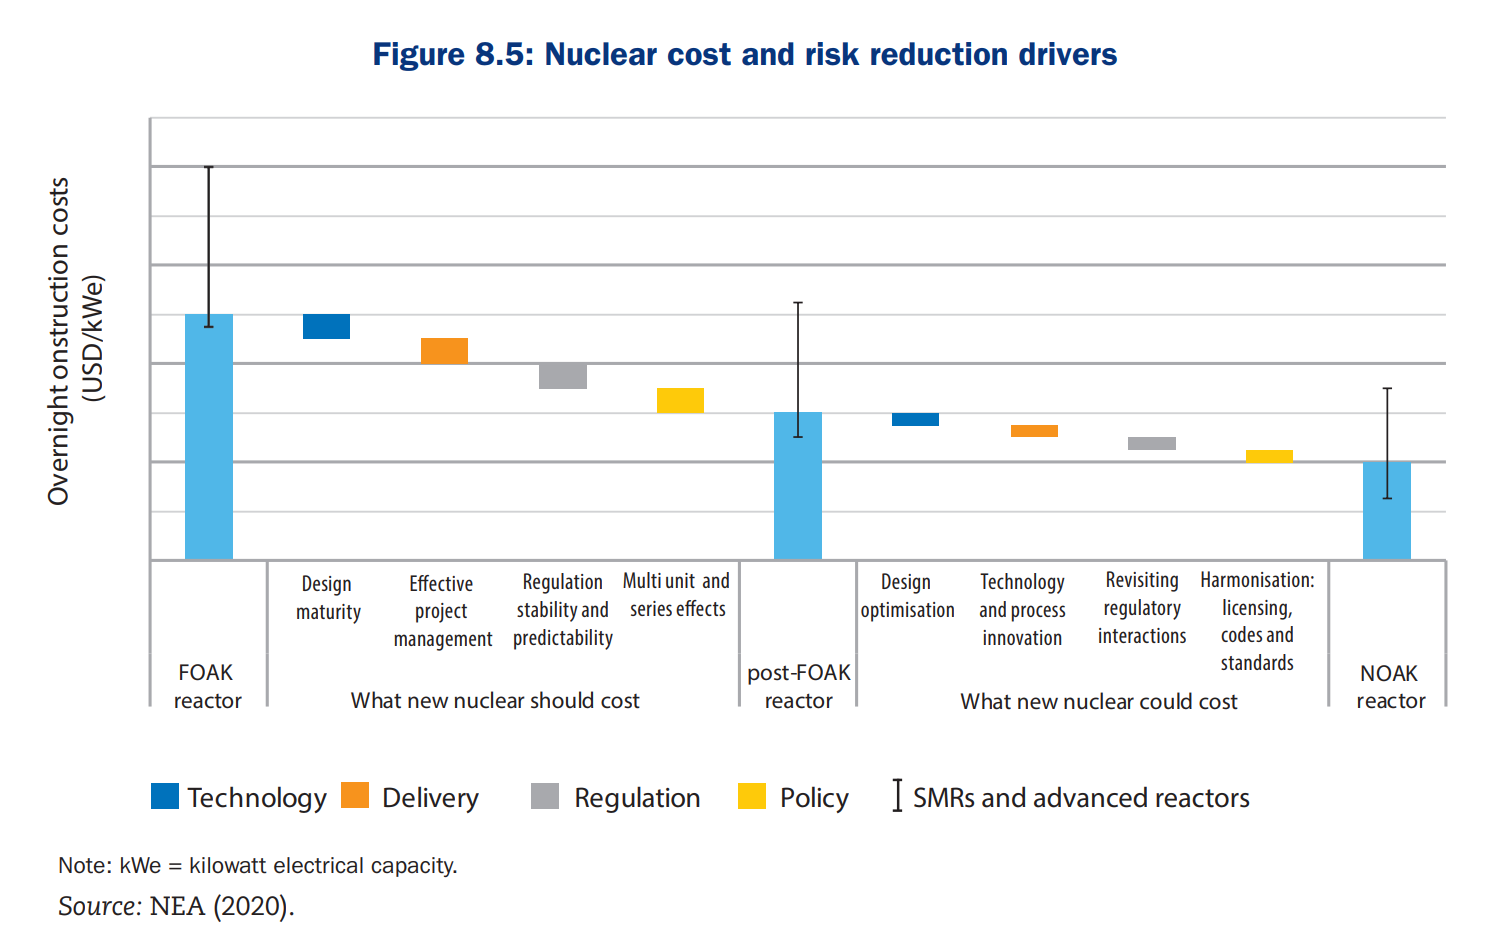
Illustrated in the figure above, we see eight steps from a FOAK to a NOAK reactor. The biggest reductions are seen in the first four steps: Design Maturity (1), Effective Project Management (2), Regulation Stability and Predictability (3), and Multi-Unit and Series Effects (4). The French EPR reactor is about to complete these four steps, and the researchers compare them. This means that we can expect reductions in the price of the reactor in future projects.
- The design of the reactor has matured
- Project management has been improved,
- Legal regulation has become more streamlined
- More units have now been built.
All steps mean that future reactors have visible price reductions in sight.
District heating
The researchers need to include the possibility of using the heat at the nuclear power plant to supply the Danes with district heating. Using the nuclear power plant for electricity and district heating in Denmark is quite apparent, as 2/3 of our heat consumption is supplied by district heating.
The efficiency of a nuclear power plant, the part of the total amount of energy that is useful and not wasted, is set in the note at 33%. This is classic for those nuclear power stations that produce only electricity. This is because there is an energy loss in all kinds of power plants, where fuel is used to heat water to drive steam turbines. Unlike burning coal, oil, biomass, and gas, however, using nuclear energy to make steam does not emit either CO2 or particle pollution.
In Denmark, we have a tradition of being masters at avoiding such energy loss by co-producing at our CHP plants. As the name suggests, these plants produce both electricity and district heating. In this way, the plants achieve significantly higher efficiency than 33%.
The Danish Energy Agency’s report from 2015 expects an efficiency of around 90% for Danish CHP plants [17]. Nuclear power plants could also achieve efficiency of the same magnitude [18].
Replace existing coal and biomass power plants.
Furthermore, the researchers must consider possible savings by building nuclear power on existing coal or biomass power plants. Since large parts of a nuclear power plant are entirely similar to other combined heat and power plants, this can save several components. The U.S. Department of Energy (DOE) estimates that 80% of U.S. coal-fired power plants can be converted to nuclear power plants, and they estimate that the savings from doing so are between 15 and 35% [19].
Denmark has a good handful of CHP plants close to the sea, with transmission stations, electricity cables, and district heating pipes. These sites are apparent to use for nuclear power stations or explore the possibility of doing so. The plants will not need large cooling towers, as they would use seawater as cooling water like the existing Danish power plants.
In summary, the researchers need to address many considerations regarding the prices of energy sources in their paper. From here, it is a recommendation to nuance the analysis significantly more.
1.1 Electricity generation costs
The researchers conclude that nuclear power is twice as expensive as offshore wind by comparing the last two offshore wind farms in Denmark, one onshore wind farm and one solar farm, Horns Rev 3, Kriegers Flak, Wind Farm Thorup-Sletten, and Heartland, respectively, with three of the most expensive nuclear power plants in world history. Olkiluoto 3, Hinkley Point C and Flamanville 3. The researchers write the following about the price comparison between nuclear power and weather-dependent energy sources:
Figure 1 also shows the opportunities that we need to have in Denmark. Here we can see that offshore wind farms in Denmark are still about the same price as nuclear power in China, just as onshore wind farms or solar farms are about the same price as lifetime extension – if it requires an investment in the plant. Based on this data, there is nothing to suggest that nuclear power investments in Denmark provide better economics than investments in renewable energy.On the contrary, the comparison shows that nuclear power approx. is twice as expensive as electricity from wind and solar.
Source: Zinck et al., 2022: Facts about Nuclear Power in Denmark |
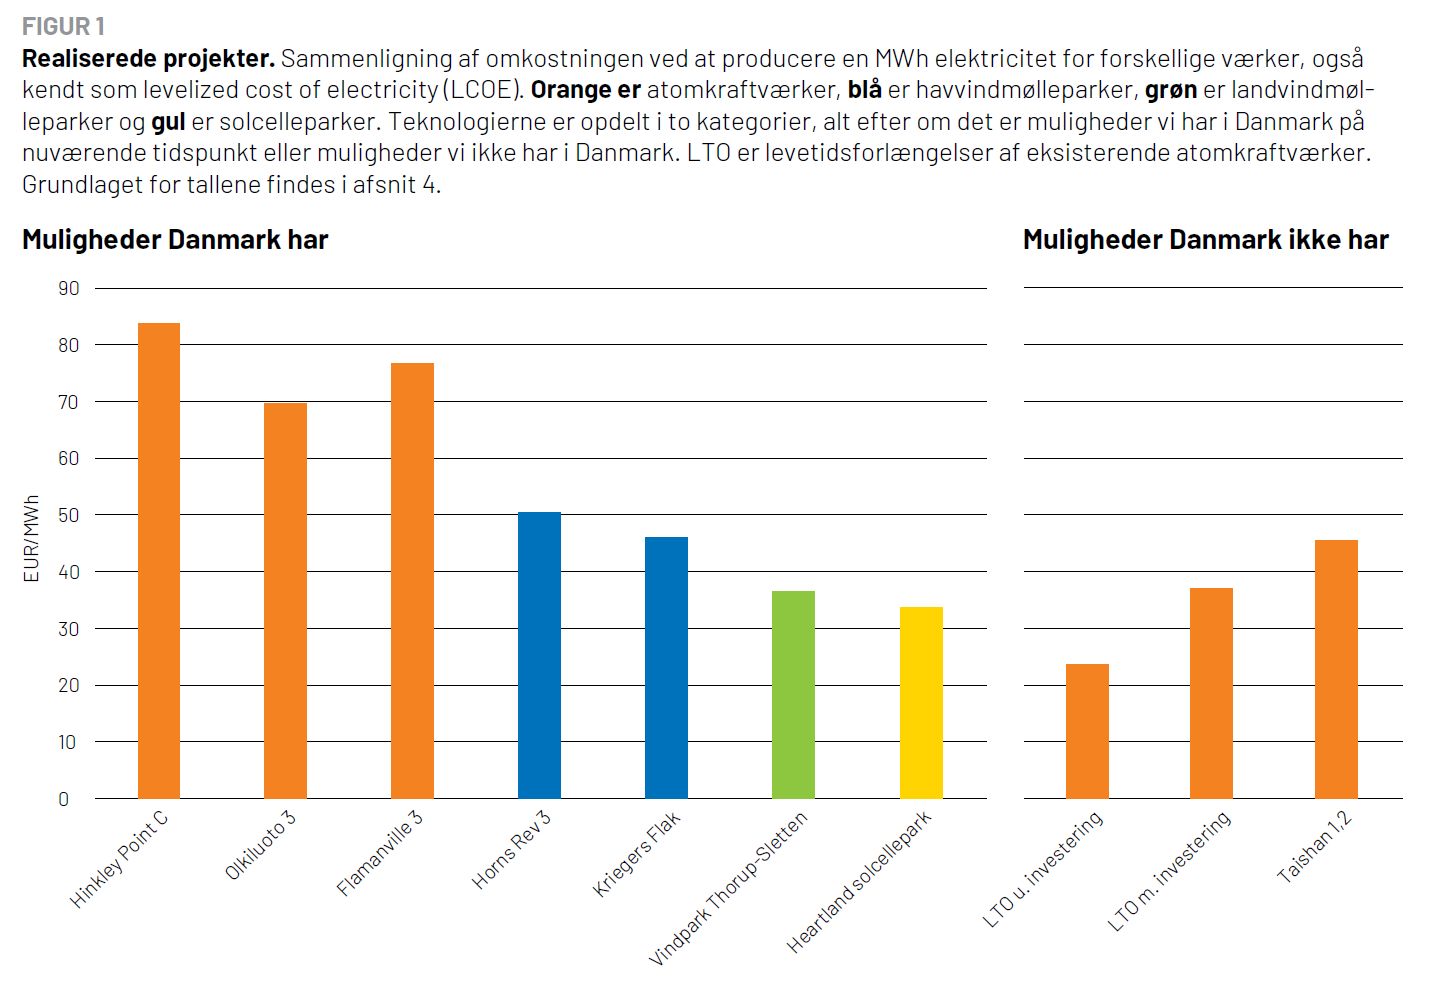
International Energy Agency (IEA)
Furthermore, the researchers support their price calculations in Figure 1 with figures from the International Energy Agency (IEA). They write that the figures from the IEA show the same pattern as the calculations in Figure 1. In section 4.3.3, the researchers note that the statistics for Nuclear Power in Europe in 2050 are constructed by taking figures from two different IEA reports. The specific costs (capital costs) come from the World Energy Model: Techno-economic inputs. Report 2021 and Operation and maintenance originate from the levelised cost of electricity calculator 2020.
For capital costs, they set a fee of €4500/kW; for Operation and maintenance, it is €14.26/MWh for nuclear power in Europe in 2050. The Operation and maintenance price comes from the IEA’s LCOE-Calculator. The only project in this overview with an operating cost of 14.26 is the Gen III project (1650 MW) in France. This operating cost applies to nuclear power in France in 2020 and says nothing about the cost of Operation and maintenance at nuclear power plants in Europe in 2050.
This leads us to the general criticism that it is strange to include figures from 2050 at all. Projections on the cost of different energy technologies 28 years into the future are pure guesswork. Especially when we look through the statistics for offshore wind, onshore wind, and solar energy in the Danish energy catalog used by the researchers, we see large price drops in the next ten years. It is therefore assumed that similar price declines we have seen with solar, onshore, and offshore wind over the past several years will continue. As mentioned, the International Energy Agency shows that the prices of raw materials used to produce weather-dependent energy sources are rising. This will most likely result in a less pronounced fall in prices than previously expected.
Incomparable
The first impression is that it makes no sense to compare the price of nuclear power with weather-based energy, as they are two different products. The International Energy Agency (IEA) writes in its latest price report that it needs to be more accurate to compare the price of controllable energy sources (nuclear) with the cost of weather-dependent energy sources (wind and solar energy) [20].
It is, therefore, not only reprehensible that the researchers use a small sample for the comparison but also that, on the basis of a one-to-one comparison between nuclear power and weather-dependent energy sources, they conclude that it is not worthwhile. It is against scientific practice and methods in the field. Therefore, the first part of the report, in which researchers compare nuclear power exclusively one-to-one with weather-dependent energy, is superfluous.
It is misleading to compare the price of controllable power from nuclear power with fluctuating power from wind and solar, as production from weather-dependent energy sources follows the weather and therefore does not necessarily match society’s demand for power. Thus, the value of the power produced by weather-dependent energy sources is significantly less for the energy system than the value of reliable power from nuclear power. The instability of weather-based power generation requires backup energy sources to be ready in the wings to take over.
Controllable energy sources such as nuclear power and hydropower also require a degree of backup, as there are, among other things, periods when the nuclear power plant needs new fuel or maintenance. However, the required amount of backup is on a completely different scale than when establishing wind and solar energy because, with solar and wind energy, you must constantly have the backup capacity to be ready.
The rapid change in production from weather-dependent energy sources must be balanced, which is not required by controllable nuclear power. Conversely, nuclear power can create this balance since it is a controllable energy source.
The researchers claim that nuclear power is not suitable for the same fast ramping as a gas turbine. However, this is not entirely true [21]. Indeed, many nuclear power plants are not designed for rapid regulation because it makes the best economic sense to run the plant at full throttle if a given electricity grid allows this. However, nuclear power plants can efficiently be designed to regulate power production quickly up and down. For example, the reactors of France and Germany can do this [22].
Thus, a nuclear reactor can go from generating 20% to 100% of its capacity in less than half an hour [23]. When one nuclear reactor does this, it is equivalent to “switching on” almost half of all Denmark’s offshore wind turbines in half an hour.
The establishment of nuclear power, therefore, requires far less backup than the establishment of wind and solar energy, where you can switch off power production quickly but where you cannot turn up more than the weather allows.
System costs
The need for backup is a negative externality in connection with establishing wind and solar energy, which increases as the share of weather-dependent energy sources in an energy system rises. A fair economic calculation, therefore, requires that these negative externalities be considered. The negative externalities are also called integration costs or system costs. When system costs are included, the calculation is called a System-LCoE (Levelized Cost of Electricity) rather than the classic LCoE that the researchers use.
The proportion of weather-dependent energy in a system is also called the penetration rate of the energy source. Research in this area shows a clear correlation between system costs and wind and solar energy penetration rates. System costs for weather-dependent energy sources increase as the share of energy sources grows.
In a peer-reviewed study published in 2013, System-LCoE is described for the first time [24]. The researchers explain that it is important to include system costs when calculating the price of weather-dependent energy sources. The system costs cover the profile, balance sheet, and grid costs, respectively. The figure below shows a clear pattern between the share of wind energy in the total system (penetration) and the system costs.
A concrete example is the recently announced additional cost of DKK 13.9 billion that electricity consumers in Denmark will have to pay for new transmission stations and transmission cables between Bornholm and Zealand in connection with the construction of a wind farm [25]. This will be referred to as an electricity grid cost, which in the figure below becomes exponentially greater the more wind is added to the energy system.
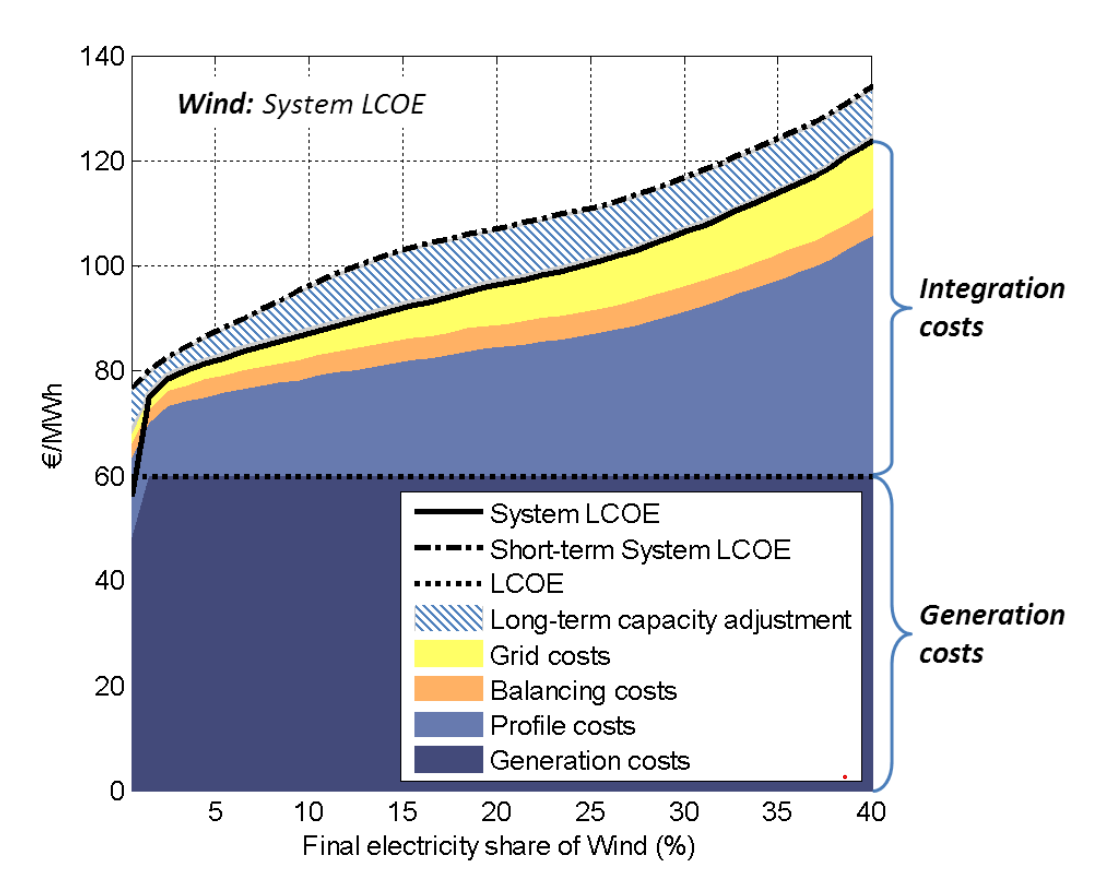
Source: Ueckerdt et al., 2013: System LCOE: What are the costs of variable renewables?
The above figure is from a paper published in 2013, which is why it is to be expected that the prices they desire are not representative of the price of wind energy today. The figure is used to illustrate how much system costs make up the total price.
It is difficult to determine whether the researchers include all the negative externalities in their energy system analysis. It is also difficult to expect all factors to be included, as system analysis is very complicated. We have previously directed criticism at precisely the system analysis that researchers use. We will discuss these criticisms in more detail in section 2.
1.2 Construction times
In the section of the memo on construction time, it is stated that to reach Denmark’s climate goal of a 70% reduction of greenhouse gases; we must focus on concrete projects that can be completed relatively quickly. In other words, a premise is being set up that we should only focus on technologies that can be achieved by 2030. We in Denmark do not want a completed nuclear power plant ready by 2030, but that is not a valid argument for why we should not invest in it. The artificial island to be built in the North Sea and the construction of an associated large wind farm will then also be irrelevant, as the first phase of the wind farm will not be ready for production until 2033, even though Energinet publicly presented the vision for this back in 2017 [26].
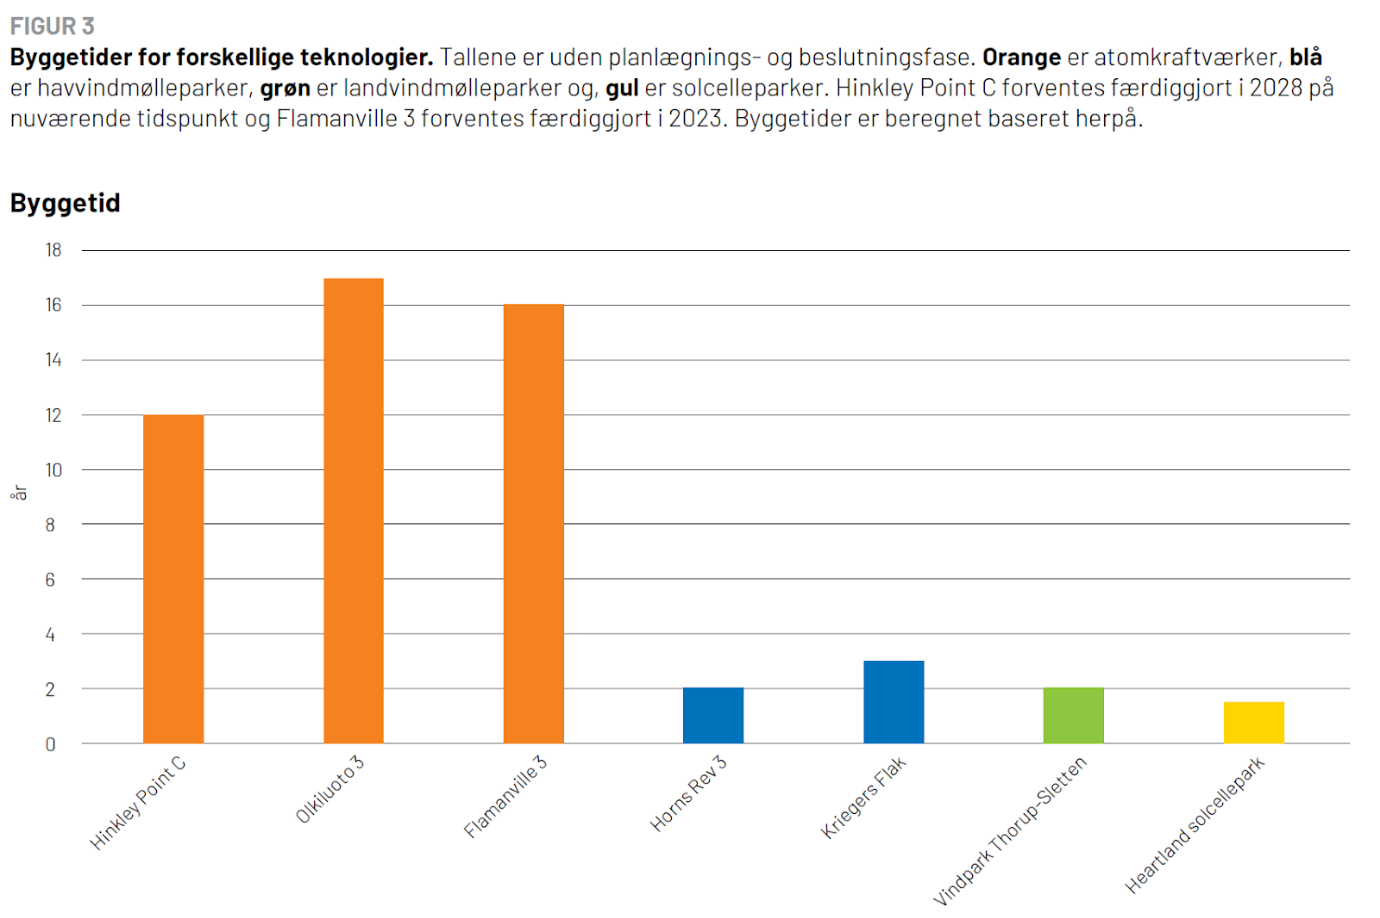
Before we consider the comparison between construction times on different energy sources that the researchers present in the paper, it is worth mentioning that they base the comparison on three nuclear power plants that are among the most delayed nuclear power plants ever, with construction times of 12, 16 and 17 years, respectively.
There are currently about 430 nuclear reactors in operation in the world. The median construction time for these is six years, which means that 50% are built in 6 years or faster [27]. For example, Barsebäck’s two reactors were built in just over four years. But it was in the 70s when you could make nuclear power quickly, you might think.
Yes, you could do that back then in Europe, but you can still do that around the world. Looking at the construction time in the world over the last 20 years, the median is seven years [28], as in many places, e.g., in Japan, South Korea, UAE, India, Russia, China, etc., nuclear power has been built relatively quickly. To single out only the three delayed nuclear power plants in Europe, all of which are even described as first-of-a-kind reactors, is, to say the least, to cherry-pick in facts.
When comparing construction times for energy technologies, it is essential to consider how much energy the respective energy technologies produce. It is difficult to compare the construction time of energy plants that supply widely different amounts of energy. Furthermore, it is essential to remember that 1 MW solar or wind capacity does NOT provide the same amount of energy as 1 MW nuclear capacity because energy sources have different capacity factors. In the sections below, we will demonstrate what the construction time looks like for the energy sources when we consider the size and capacity factor.
Accurate comparison between energy technologies
We described in section 1.1 that the International Energy Agency (IEA) advises against comparing the price of weather-dependent energy sources with controllable energy sources, which is why this also applies to the construction time.
Nevertheless, the researchers do so in the memo. In Figure 3, the researchers calculate the construction time of three nuclear power plants, two offshore wind farms, one onshore wind farm, and one solar farm, respectively, showing that the nuclear power plants take significantly longer. However, the researchers do not consider the size difference between the capacities of the energy plants. They also ignore the fact that there are differences in how often the different energy sources can supply up to their maximum capacity.
For example, they compare a small North Jutland wind farm with 18 wind turbines with an installed capacity of 77.4 MW with the prominent British nuclear power plant Hinkley Point C of 3200 MW. It’s like comparing a truck to a bicycle. Of course, it takes longer to build a truck than a bicycle, but the truck can transport significantly more than a bicycle.
The problem arises when we examine what the different plants produce regarding energy. For the three nuclear power plants, this is 3200 MW capacity for Hinkley Point C, 1600 MW for Olkiluoto 3, and 1600 MW for Flamanville 3. All three plants are expected to have a capacity factor of around 90%. By taking into account the annual production from the different plants, we can calculate how much TWh the different energy sources add each year with the formula:
MW x 24 hours x 365 days x 90% = TWh/year
Using the above formula, we get 25 TWh/year for Hinkley Point C and 12 TWh/year for Hinkley Point C, and 12 TWh/year for Hinkley Point C, respectively. Olkiluoto 3 and Flamanville 3.
Horns Rev 3 has a capacity of 407 MW, Kriegers Flak of 604 MW, onshore wind farm Thorup-Sletten of 77.4 MW, and Heartland solar farm of 207 MW. At first glance, there are very different sizes of nuclear power and energy plants with renewable energy. Of course, wind and solar farms are faster to build when they are significantly smaller.
In addition, it is important to remember that the capacity factor for offshore wind, onshore wind, and solar cells is also significantly lower than for nuclear power. Vattenfall expects a capacity factor of around 52% for offshore wind for Horns Rev 3 and Kriegers Flak. For Thorup-Sletten onshore wind farm, the capacity factor is about 25%. However, the Danish Energy Agency’s technology catalog states that the capacity factor for onshore wind in Denmark in 2020 is 38%, but Energinet’s production figures for Thorup-Sletten in 2021 show a capacity factor of 25% [29]. It was impossible to find the specific capacity factor for the solar park Heartland, so we instead used the Danish Energy Agency’s capacity factor for solar cells in Denmark of 14%.
With the same formula, this gives 2.7 TWh/year for Horns rev 3, 1.8 TWh/year for Krigers Flak, 0.17 TWh/year for Thorup-Slette, and 0.254 TWh/year for Heartland.
If the 25 TWh nuclear power plant Hinkley Point C is compared with the 2.7 TWh offshore wind farm Horns Rev 3, it takes (25/2.7) = 9 times Horns Rev 3 to get the same amount of energy production in one year as Hinkley Point C. Furthermore, it is essential to remember that the energy from Hinkley Point C is controllable, while the power from Horns Rev 3 comes in clumps at unpredictable times.
Below we see an overview of the different plants and their respective capacity, capacity factor, construction time, annual production, and production in relation to the construction time.
| Anlæg | Installeret kapacitet | Kapacitets-faktor | Byggetid | Årlig produktion | Produktion / år |
| Hinkley Point C | 3200 MW | 90% | 12 år | 25,23 TWh | 2,10 TWh |
| Olkiluoto 3 | 1600 MW | 90% | 17 år | 12,61 TWh | 0,74 TWh |
| Flamanville | 1600 MW | 90% | 16 år | 12,61 TWh | 0,79 TWh |
| Krigers Flak | 407 MW | 52% | 3 år | 1,85 TWh | 0,62 TWh |
| Horns Rev 3 | 604 MW | 52% | 2 år | 2,75 TWh | 1,38 TWh |
| Thorup-Sletten | 77,4 MW | 25% | 2 år | 0,17 TWh | 0,09 TWh |
| Heartland | 207 MW | 14% | 1 år | 0,25 TWh | 0,25 TWh |
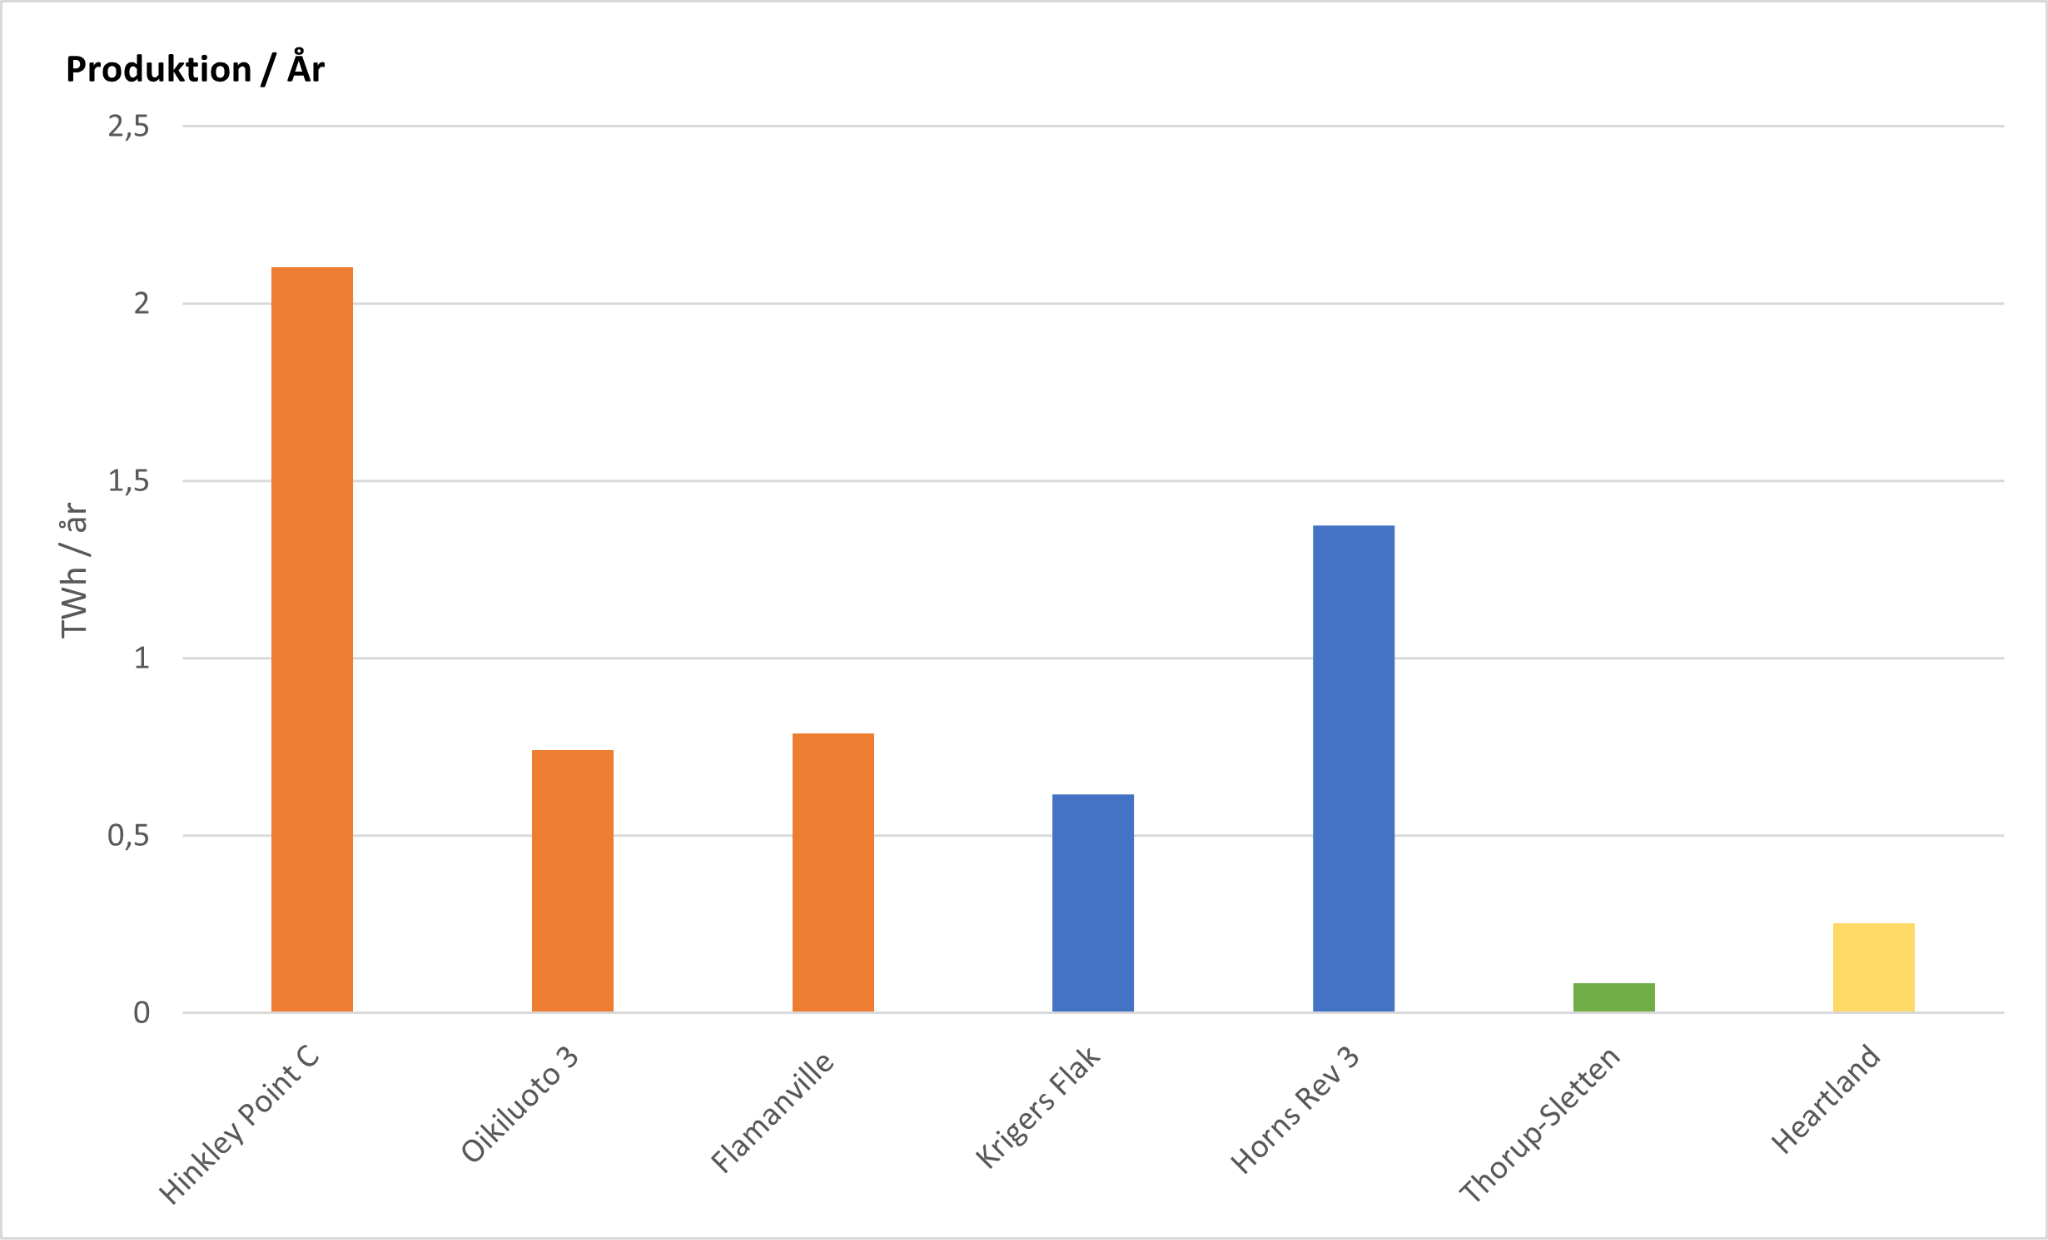
So there is a clear picture that when we only look at the construction time without considering capacity and capacity factors, it seems that nuclear power plants take far too many years to build, and weather-dependent energy sources can be built in a snap. However, this is only half the truth since the plant sizes of the weather-dependent energy sources are considerably smaller, and their capacity factor is also significantly lower.
The fact that the researchers behind the note do not relate to this is extremely problematic, as it is highly unnuanced to present data as they do in Figure 3.
Planning time
The researchers note that planning time is critical and difficult to calculate or predict. In addition, the researchers present that the planning time for Olkiluoto 3 was five years, and eight years for Hinkley Point C. In continuation, they give the planning times for Horns Rev 3 and Krigers Flak to be between 3-6 years, as they were both part of a political agreement in 2012.
However, the planning times for Horns Rev 3 and Krigers Flak, respectively, could be more accurate. The researchers are correct that Krigers Flak was part of the Folketing’s energy agreement in 2012, but that is only a half-truth.
We have to go further back to find the origins of Krigers Flak. In 1996, the then government’s plan for sustainable energy development called Energy Plan21 was published. Here, Denmark’s future energy system was planned, and it was decided to develop the Offshore Wind Action Plan, which was published in 1997. In it, it was decided to expand Danish offshore wind by 4000 MW by 2030 [30].
An article in Ingeniøren from 2003 states that Krigers Flak, along with ten other sites, was already identified in the 1997 Offshore Wind Action Plan and that screening from 2003 narrowed the area down to four locations, of which Krigers Flak was one of them [31]. It is then stated in a report by the Danish Energy Agency that screening of the area at Krigers Flak has been carried out for EIA approval and the establishment of an offshore wind farm [32].
In 2005, the Danish Energy Agency, Energinet, the Danish Maritime Authority, the Danish Nature Agency, and DTU Risø established the Offshore Wind Committee. In a report by the Danish Energy Agency from 2008, Offshore Wind Action Plan, proceeding with the project Krigers Flak is also recommended. They estimate that it will not be completed by 2012, but some work has already been done on the planning of the park [33].
Therefore, it needs to be corrected that Krigers Flak only had a planning time of 6 years (2012-2018). The planning of the park already took place in 1997, which is a planning time of 21 years (1997-2018). The total construction time of Krigers Flak can therefore be assumed to be up to 24 years (1997-2021).
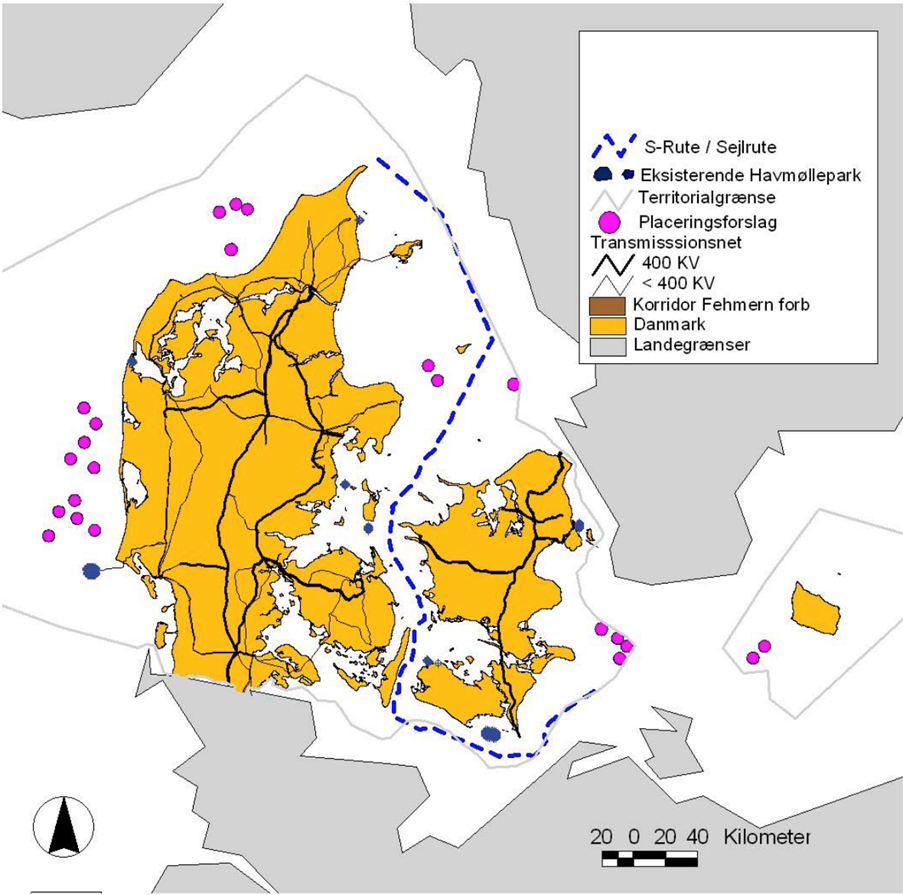
It is a general trend that offshore wind farms in Denmark have significantly longer planning times than those described in the memo. The map below can be found in the report Future Offshore Wind Locations – 2025 from 2007, and it shows many of the areas we are working to establish offshore wind turbines towards 2030 [34].
In the Energy Agreement 2012, which included Kriegers Flak and Horns Rev III, it was also decided that 500 MW of coastal offshore wind turbines should be built. This was later narrowed down to a 350MW offshore wind farm, Vesterhav Syd and Nord, and was originally due to be completed in 2020, but due to delays, the goal is now for it to be ready by the end of 2023, 11 years after adoption [35].
The same applies to two offshore wind farms adopted in the Energy Agreement 2018, located at Hesselø and Bornholm. At Hesselø, the preliminary studies showed that the chosen location was unsuitable for the construction of the turbines, and new studies are now underway to determine a spot to place them. This has delayed the project, and the new goal is now for the park to be completed by the end of 2029 at the latest, which is two years later than the original plan, and almost 12 years after the agreement was made [36].
Energiø Bornholm, a further development of the wind farm that, together with Thor and Hesselø, was decided in 2018, is also planned to be completed in 2030, 12 years after it was adopted [37]. The area for the location of the turbines can also be found in the Danish Energy Agency’s report Future offshore wind turbine locations – 2025 from 2007, so it is a project that has been underway for a long time (Can be seen in the map above).
These wind turbine projects, among others, constitute a significant part of the Danish expansion of offshore wind turbines and are thus outside the external limits of the memorandum for establishing wind and solar, with a planning time of 6 years and construction time of 3 years. To present a planning time for wind turbine projects of 1-6 years is quite misleading, as many of the larger projects in recent times have proven to take significantly longer.
For the Olkiluoto 3 nuclear power plant, scientists assume a planning time of about five years. The application for the plant was submitted in 2000 and later approved by the Finnish government in 2005. We have searched for evidence that the planning time should be longer, but we cannot find any evidence that the planning of Olkiluoto 3 should have taken place before the year 2000.
Similarly, for Hinkley Point C, we find no evidence that the researchers’ assumptions about planning time from 2008 to 2016 are wrong.
Overall, we note that the planning times for the Danish wind turbine projects are highly misleading. Scientists set a planning time for nuclear power of 5 to 8 years, which we do not dispute. This is assumed to be 1-6 years for wind and solar, but based on our above presentation, it turns out that a number of wind turbine projects in Denmark have been underway for almost two decades.
Of course, the above planning and construction times for both wind farms and nuclear power plants will only sometimes apply in the future. We welcome that politicians are talking about reducing the time-consuming and bureaucratic processes for planning and approving wind turbines and nuclear power plants.
1.3 Support needs for investment in nuclear and renewable energy
The researchers compare the need for state support between the wind as mentioned above turbine projects, Horns Rev 3 and Krigers Flak, as well as the recently decided wind farm “Thor,” which does not receive state aid, with the state support for the world’s most expensive nuclear power plant Hinkley Point C. In doing so, they insinuate that support for these projects will represent future projects.
Firstly, it is a meaningless comparison. Society gains greater value by supporting a controllable energy source that better supports the security of supply and puts less strain on our planet’s resources and area, according to the latest UN Life Cycle Report on Energy Sources [38]. Therefore, DKK 100 state aid for nuclear power provides higher value to society than DKK 100 state aid for wind.
Secondly, the researchers again miss the point that the more fluctuating energy there is in an energy system, the higher the marginal cost of adding more fluctuating energy. Therefore, all other things being equal, the need for state aid will increase to add more wind and solar power in the future.
One cannot therefore assume, as the researchers do, that because we do not give individual wind projects state support today, this will also be the case in the future. Or assume that because a first-of-a-kind nuclear power plant in England was expensive to support, that will also be the case in the future.
In the UK, lessons have been learned, and a smarter investment model has been found to give investors certainty in building the next nuclear power station, Sizewell C. The model will lower the investment rate and thus the price significantly, as the investment rate is by far the largest cost associated with building a nuclear power plant borrowing costs amounted to as much as 2/3 of the price of Hinkley Point C [39]. The new financing model is expected to result in total savings of £30 billion for electricity consumers, not investors, over the plant’s lifetime [40].
1.4 Nuclear power as peak and reserve load
The researchers are critical of whether nuclear power can act as peak and reserve load. We have previously described in the note that it is not true that nuclear power cannot regulate its electricity production quickly up and down, although it does make the most economic sense for the nuclear power plant itself to run as often as possible.
In the researchers’ study of what the price is for having nuclear power as a backup, it is assumed that the nuclear power plant should ONLY stand as a backup for wind and solar and thus have no independent production for the electricity grid. Thus, it is not calculated whether there is a socio-economic gain from giving nuclear power plants a certain fixed amount of energy production, i.e., also during periods when the wind blows, and the sun shines, as a kind of financial compensation from the wind turbines and solar cells so that the nuclear power plants in return can deliver during periods without wind and sun.
Nor is it calculated in a scenario where the nuclear power plants are used for district heating production and power-to-x production, respectively, in cases where wind turbines and solar cells can cover the power demand themselves. Like any other industrial plant, a power-to-x plant wants to capitalize on its capital costs by producing as much as possible. It is conceivable that the nuclear power station can make a better contribution to this through its continuous production. The nuclear power plant must then be connected to the electricity grid when there is not enough wind and solar energy.
Nor is it calculated on the value of Denmark being able to improve its security of supply rather than being fully dependent on our neighboring countries. In Norway, there is an emerging political discussion about whether the electricity supply to the rest of Europe should be shut off during critical periods because the European electricity market also drives prices high in Norway, even though they can produce cheap electricity with hydropower. Of course, we hope this does not happen, but it illustrates that leaving one’s security of supply to other countries always comes with risks.
In the scenario calculated by the researchers, it is assumed that a nuclear power plant will only operate 1000 hours per year, which corresponds to a capacity factor of 11.4%. This means that according to the researchers’ calculations, Denmark only requires to be covered 11.4% of the time by stable energy sources, while everything else can be done with wind, solar, PtX, and imports from abroad. This is a very optimistic assumption that is not further documented by the researchers. Instead, they refer to IDA’s climate response 2045, which the Danish Atomic Energy Association Ja Tak has already criticized in an interview with Ingeniøren [41]. We certainly do not believe that IDA’s climate response can be used as a bible within energy system models.
Green biogas?
In the researchers’ scenario regarding reserve and peak loads, nuclear power is compared to biogas, which the researchers call “green gas.” Whether biogas can be called “green” is a great discussion. Biogas is made mainly from waste products from animal production. Animal production is challenged by experts for various environmental and climate reasons, which society should have less of in the future. Energy recovery is also at the bottom of the resource pyramid, which defines the value of utilizing biological waste resources [42]. Therefore, when resources are allocated to biogas energy production, it often means that the production of other goods that could have used the same waste resources must use an increased amount of virgin resources, often with relatively more significant CO2 emissions as a result overall.
Then there is the problem of leaks of the potent greenhouse gas methane from biogas plants. A recent report to the Danish Energy Agency showed that 69 of the country’s 144 biogas plants had an average methane loss of 2.5%. As many as 38 percent of biogas plants are above the 6% leakage limit, which, according to researchers from Aarhus University, indicates that a biogas plant has a negative climate effect seen over 20 years [43].
It should therefore be questioned whether we as a society should make our energy supply dependent on biogas, which depends on waste products, of which organization will have less in the future, and where energy efficiency is the worst possible use of resources.
The point is not that we should not have biogas at all, which is, of course, significantly preferable to natural gas. The fact is that it is an unequal comparison from a purely climate and environmental perspective to compare biogas with nuclear power. According to the latest UN report, nuclear power is the energy source with the minor CO2 emissions and, at the same time, the energy source that requires the fewest raw materials and space from nature over the life cycle of energy sources [44].
1.5 Small modular reactors
Small modular reactors include several reactor types under development in many countries. Here in Denmark alone, we have two companies in the field; Seaborg Technologies and Copenhagen Atomics. The researchers conclude quickly that small modular reactors are not suitable for Denmark.
However, the researchers assume that all types of small modular reactors fall under one umbrella regarding maturity, price, and speed, which is highly questionable. To be a relevant input, one should investigate both the possibilities of the conventional light-water reactors on a smaller scale from companies such as Rolls Royce, NuScale, and GE Hitachi, as well as the options of the so-called 4th generation nuclear power, where molten salt reactors belong, among others. Both types are a maximum of 300 MW reactors (classical reactors are over 1000 MW) and therefore fall under the collective term “small modular reactors.” However, there are significant differences in how marketable they are.
4th generation nuclear power is developing rapidly, and there are huge perspectives, but there is still some uncertainty about how quickly they can get design approvals. In many cases, the other small modular reactors can already be ordered today, as they have just been done in Canada, where they expect the reactors to be operational by 2030 [45]. This type of nuclear power is, among other things, what the Swedes will now implement plans to expand in the coming years.
The researchers refer to one study about the price for small modular reactors is not competitive and accept this conclusion without nuance. Here’s the finding from another study:
“These comparisons illustrate that design simplification, reduced componentry, modularity, and other features of the SMR design result in significant savings in overall base costs.” [46].
Last but not least, the researchers cite a personal statement from Seaborg CEO Troels Schönfeldt as a conclusion that nuclear power does not make sense in Denmark. It is not tenable, and frankly a little embarrassing, that scientists use anecdotal statements as evidence. Troels Schønfeldt’s statement was also criticized in an article in Altinget written by a Danish senior researcher in materials physics [47].
2- Energy system analysis
In the introduction, the researchers write that the energy system analysis is based on IDA’s climate response 2045. We have previously criticized this climate response in an article debate with Brian vad Mathiesen, where we pointed out that the climate answer assumes, among other things;
1- Denmark’s energy consumption will fall by as much as 30% towards 2030, even though our energy consumption today has only marginally decreased compared to 30 years ago.
2- In 2045 Denmark still burns wood and straw to obtain energy corresponding to 26.7 TWh.
3- Denmark can import sufficient electricity from neighboring countries.
- It is assumed that we can always import as much as the cables can pull – the availability of fixed capacity abroad is not modelled. This means that you cannot say anything about the price of the import flow either. In a European power grid in crisis, which is pressured on marginal energy, the prices of imported back up are sky high.
We therefore do not believe that the model that the researchers use in their energy system analysis is sufficient, since the assumptions behind it are highly criticisable.
It is also important to get a better overview of whether all negative externalities of weather-dependent energy sources are included in the energy system analysis. For example, it is not clear whether the energy system model includes the expansion of the electricity grid to a sufficient extent to connect offshore wind. In IDA’s climate response 2045, the researchers write the following:
“Energinet and grid companies should prepare a grid connection rate for onshore wind and solar PV that reflects the marginal costs required for grid expansion. These can be high in areas with low electricity consumption and already high shares of renewable energy, but low or completely absent in areas with good electricity grids and high electricity consumption” [48].
The above wording gives a clear picture of whether all externalities to the electricity grid are included in the energy system model. We described in section 1.1 that system costs are growing exponentially in electricity grids, where the share of weather-dependent energy sources increases significantly. We are therefore concerned that the systems analysis used by researchers has not had this in mind.
On page 17 of the paper, the researchers write what assumptions lie behind including nuclear power in their energy system model. Firstly, they set the cost of capital on nuclear power at €6180/MW. They do this by taking the average money price from their calculations and the IEA’s projections for 2050. It seems odd since they use operating costs from 2020 from the IEA but not the capital costs from the IEA in 2020. These are significantly less than the average they construct. For France, according to the LCoE calculator, they are around €4000/MW [49].
We further find that the same biomass consumption occurs in calculations. This means that the researchers only compare the price when nuclear power replaces offshore wind, onshore wind, and solar energy, but not if it were to replace biomass. As described above, wood and straw will still be burned in 2045 in IDA’s climate response, corresponding to 26.7 TWh.
Furthermore, the researchers compare 1000 MW nuclear power with 1475 MW offshore wind or 2043 MW onshore wind. It is difficult to determine what capacity factor they’re counting on here. This capacity factor is approximately 75% for nuclear, 50% for offshore wind, and 35% for onshore wind. It was better formulated what capacity factor they use here. Section 4.3.1 shows their overview of operating hours, where onshore wind in 2020 is set at approximately 38% and offshore wind at 50%. However, these figures do not exactly match how much onshore wind, offshore wind, and solar cells are needed to replace nuclear power. This may be due to the inclusion of PtX capacity etc., but a more detailed description needs to be included.
In many places in the world, nuclear power is operated with +90% capacity factor. It cannot be ruled out that it is unrealistic to have such a high capacity factor in a Danish context, but it requires detailed, well-worked justifications. It is also funny that the capacity factor for the wind farm that the researchers have chosen to highlight in section 1, Thorup Sletten, has a capacity factor of 25%, but here it is assumed to be around a 35% capacity factor for Danish onshore wind.
However, the researchers should not only compare nuclear power with wind and solar, but instead with biomass, coal, oil and gas. The researchers do not comment on this. They mention that in IDA’s climate response 2045, 5 GW of onshore wind, 14 GW of offshore wind and 10 GW of solar cells have been installed in Denmark. However, they fail to mention the large amounts of biomass that are still being used in Denmark at that time according to the climate response.
In the energy system model, 35.6 TWh per year is used for district heating, where a large part comes from biomass. Why not look at the possibility of nuclear power replacing this? They assume, as previously mentioned that nuclear power should only be used to produce electricity, thus achieving an efficiency of only 33%, as much of the heat is wasted.
How much efficiency nuclear power will achieve in a Danish energy system is difficult to predict. It will depend on how much of the thermal capacity from the plants is used for district heating and how much is used for electricity production.
A large nuclear reactor, such as an EPR, has a thermal capacity of 4500 MW. The reactor is expected to have an efficiency of 33% due to the immense heat waste used to generate the power. If half of the thermal energy of 2250 MW went to district heating, with the remaining 2250 MW of thermal energy, we could produce 743 MW of electrical power. The plant will produce 2993 MW of energy, giving an efficiency of 66.5%.
It thus provides twice as much efficiency by using half of the thermal energy for district heating. With the flexible operation, the production from the plant could be regulated according to the fluctuating heat consumption over the year so that district heating production from the plant is higher in the winter months and lower in the summer months. In the case of surplus electricity output, synthetic fuels or hydrogen can be produced by electrolysis.
There are thus several areas for improvement and criticisms in the researchers’ energy systems analysis, which we hope they will consider when preparing version 2.0 of their paper.
3- Remaining issues
3.1 Where in Denmark should such nuclear power plants be located
The researchers ask a hypothetical but relevant question, which of course cannot be answered directly. A commission should be set up to identify suitable locations in Denmark for nuclear power plants. However, as previously mentioned, it would be obvious to investigate the possibilities of using the infrastructure and the location of the many cogeneration plants we have in the country.
3.2 Risk Placement
The researchers write that we must consider that an accident can happen, which will cost incredible sums of money. Here they draw attention to the Fukushima accident, in which a tsunami hit the east coast of Japan and destroyed a nuclear power plant. They compare the cost of this accident with a potential accident in Denmark, which is very reprehensible as we are not at risk of a tsunami in Denmark.
The accident was caused by the world’s 4th largest earthquake and a 13-15 meters high tidal wave, which destroyed three BWR reactors from the 60s, which cannot be compared to the generation of reactors we build today [50].
No nuances are given, and it is, therefore, between the lines that a hypothetical EPR reactor in Denmark could crash similarly.
The European Commission’s Joint Research Center writes in a section on the safety of energy sources that third-generation nuclear power is the safest way of all to generate electricity:
“These latest technology developments are reflected in the meager fatality rate for the Gen III EPR design. The fatality rates characterizing state-of-the-art Gen III NPPs are the lowest of all the electricity generation technologies” [51].
In the note, the researchers refer to the expensive clean-up in Fukushima prefecture after the accident, should things go wrong. However, they fail to acknowledge that the evacuation of thousands of people, with hindsight, was not justifiable from the point of view of health.
According to the United Nations Radiation Experts (UNSCEAR), the radiation release has not caused any sickness or death, and they do not expect this to happen in the future [52].
Recent research shows that no one should have been evacuated in Japan, as the evacuation was associated with significantly higher health costs, especially for the elderly and vulnerable, than the size of the radiation release [53].
The population received a very minimal radiation dose, so low that the amount for more than 99% of the evacuees corresponded to less than half the dose received from a regular CT scan of the spine in the hospital [54].
When we talk about radioactive radiation, the risk of harm to health is not about whether you are exposed to it but the dose. Fortunately for that, radiation exists everywhere in our world, so it’s good that the human body has evolved to be able to handle low amounts of radiation [55],
In many parts of the world, there is much higher natural background radiation than in Fukushima. If Europe had the same evacuation limit regarding the amount of accepted radiation, large parts would have to be evacuated [56].
The researchers fail entirely to address these facts. Fukushima is an example of political mismanagement during a crisis. This happens across a lot of societal challenges. Take, for example, the current corona management in China, where politically determined demands have imposed enormous costs on China relative to handling in the West.
3.3 How radioactive waste is managed and where should it be deposited
The researchers also pretend that we need to learn how to handle and where to store the nuclear waste, that is, the spent fuel. The researchers should otherwise be aware that as recently as January 2022, the Danish authority GEUS published a report in which they wrote that large areas in the Danish subsoil are expected to be well suited to deposit the waste 500 meters underground, isolated from the biosphere, which, however, requires further detailed studies.
GEUS’ report complies with IAEA guidelines for storage facilities for highly radioactive waste. Although Denmark no longer has high-level radioactive waste, only low- and medium-radioactive, the locations identified in GEUS’ report will thus also be suitable for the disposal of spent nuclear fuel, i.e., the highly radioactive waste [57].
We can learn from Finland’s or Sweden’s final depot projects. Finland’s is wholly completed and will be put into operation in a few years. The cost of the Finnish deposit is 0.01 kroner, i.e., 1 øre, per kWh (the first 30 years). Landfill costs are, therefore, peanuts in the economy of a nuclear power plant. Nothing prevents Denmark from creating a similar final depot.
It should be mentioned here that in Finland, there has been a struggle between municipalities to take responsibility for this final landfill because it creates jobs and wealth for the city [58]. The last Finnish depot Onkalo is today a tourist attraction.
Scientists should also know that waste has been handled safely and efficiently in all countries with nuclear power. Thus, no human being has ever been harmed or killed by civil nuclear waste [59]. For decades, the “garbage” we have been schooled in fear has never hurt anyone.
Nor is there any environmental damage, according to the report above by the EU’s Joint Research Centre JRC. The researchers are thus problematizing something that has been solved from a technical point of view. Shouldn’t we be more concerned about solving the world’s climate and environmental challenges rather than focusing on scare scenarios?
The question is whether it finally makes sense to landfill the waste. A significant reason why the world’s nuclear industry has yet to rush to the final landfill of garbage is that the spent fuel still contains 95% of the energy from the original fuel. Thus, nuclear waste has the potential to become extremely valuable. Many new fourth-generation nuclear reactors can use almost all the energy in nuclear waste for energy production, thus reducing the need for storage for final landfill.
Although all of America’s stored nuclear waste only takes up one football field at the height of ten meters [60], this nuclear waste can supply the United States for 2500 years using fourth-generation nuclear power, with the same amount of electricity as nuclear power generates in the United States today.
France already recycles its nuclear waste, meaning it derives 17% of its electricity from nuclear waste. They recycle through the so-called reprocessing of spent fuel, which is a significantly more expensive way to obtain fuel than simply buying new uranium, which is why few countries use this recycling today [61].
Sources
[1]. Ingeniøren, 2022 Researcher attacks memo on nuclear power in Denmark: 7 loose claims and factual errors[2]. DR, 2020: Shortly before groundbreaking: How Einar and Henrik stopped nuclear power in Denmark[3]. Massachusetts Institute of Technology (MIT), 2018: The Future of Nuclear Energy in a Carbon-Constrained World – An Interdisciplinary MIT Study[4]. International Energy Agency (IEA), 2021: What is the impact of increasing commodity and energy prices on solar PV, wind, and biofuels?[5]. Recharge, Global news and intelligence for the Energy Transition, 2022: ‘Offshore wind is fundamentally sick… no one’s making money’: ex-Ørsted technology chief[6]. Wood Machenzie, 2022: Wind industry faces a perfect storm of profit pressures[7]. Financial Post, 2022: Wind power’s colossal market failure’ threatens climate fight[8]. TV2, 2022: Wind turbine giant fires 800 in Denmark[9]. Scientific American, 2016: Why China is Dominating the Solar Industry[10]. TV2, 2022: See here if your solar panels are connected to forced labor[11]. Energyconnects, 2021: Why It’s So Hard for the Solar Industry to Quit Xinjiang[12] TV2, 2022: Solar cells in Denmark may be made with forced labor in China[13]. Danwatch, 2022: EU to ban import of goods produced with forced labour[14]. World Nuclear News, 2022: Poland’s Westinghouse choice ‘deepens strategic relationship’ with USA[15]. DW, 2022: US, South Korean firms to run Polish nuclear plants[16]. International Energy Agency, 2020: Projected Cost of Generating Electricity 2020 (Chapter 8.3 – pages 151-154)[17]. Danish Energy Agency, 2015: Background report E: Electricity and district heating[18] Powermag, 2022: District Heating Supply from Nuclear Power Plants: Technical and Economic Aspects[19]. Department of Energy, 2022: DOE Report Finds Hundreds of Retiring Coal Plant Sites Could Convert to Nuclear[20]. International Energy Agency, 2020: Projected Cost of Generating Electricity 2020 (page 18)[21]. Powermag, 2019: Flexible Operation of Nuclear Power Plants Ramps Up[22]. Korhonen, 2015: Graphic of the Week: Can nuclear plants load-follow?[23]. National Renewable Energy Laboratory (NREC), 2020: Flexible Nuclear Energy for Clean Energy Systems[24]. Ueckerdt et al., 2013: System LCOE: What are the costs of variable renewables?[25]. Finance, 2022: Denmark’s first energy island: Dan Jørgensen approves huge bill for beleaguered electricity customers[26]. Energywatch, 2019: New project to secure artificial energy island[27]. Energy Matters, 2016: How long does it take to build a nuclear power plant?[28]. World Nuclear Association, 2022: World Nuclear Performance Report, 2022[29]. Danish Energy Agency, 2022: Master data register for wind power plants[30]. Danish Energy Agency, 1996: Energy 21 – The Government’s Energy Action Plan 1996[31]. The Engineer, 2003: Four possible sites for new offshore wind farms[32]. Danish Energy Agency, 2004: Summary of consultation responses received in connection with the Danish Energy Agency’s screening of marine areas at Rødsand and Gedser in connection with tenders for offshore wind turbines[33]. Danish Energy Agency, 2008: Offshore Wind Action Plan 2008 – Follow-up to the mapping report “Future offshore wind turbine locations – 2025”[34]. Danish Energy Agency, 2007: Future offshore wind turbine location – 2025[35]. Danish Energy Agency, 2012: Agreement between the government (Social Democrats, Radical Left, Socialist People’s Party) and Venstre, Danish People’s Party, Red-Green Alliance, and Conservative People’s Party on Danish energy policy 2012-2020[36]. Energinet, 2022: Hesselø offshore wind farm[37]. Ministry of Finance, 2020: Climate Agreement for Energy and Industry etc. 2020[38]. UNECE, 2022: Carbon Neutrality in the UNECE Region: Integrated Life-cycle Assessment of Electricity Sources[39]. Medium, 2019: The Hinkley Point C case: is nuclear energy expensive?[40]. Department for Business, Energy & Industrial Strategy, 2021: New finance model to cut the cost of new nuclear power stations[41]. Ingeniøren, 2021: Debate: Should we have nuclear power in Denmark?[42]. Danish Technological Institute, 2018: The Danish opportunities for transition to a bioeconomy – what transition are we talking about?[43]. Ingeniøren, 2021: The Danish Council on Climate Change on biogas support: It is quite obvious to make counterclaims[44]. UNECE, 2022: Carbon Neutrality in the UNECE Region: Integrated Life-cycle Assessment of Electricity Sources[45]. Powermag, 2022: Canada Bank Group Pledges Millions Toward Nuclear Power Project[46]. Black et al., 2019: Economic viability of light water small modular nuclear reactors: General methodology and vendor data[47]. Althing, 2022: Physicist: Of course, it is relevant to discuss nuclear power in Denmark[48]. Lund et al., 2021: IDA’s Climate Response 2045: How to Become Climate Neutral (page 57)[49]. International Energy Agency (IEA), 2020: Projected Costs of Generating Electricity 2020 (page 49)[50]. World Nuclear Association, 2022: Fukushima: Background on Reactors[51]. Joint Research Center (JRC), 2021: Technical assessment of nuclear energy with respect to the ‘do no significant harm’ criteria of Regulation (EU) 2020/852 (‘Taxonomy Regulation’)[52]. United Nations Information Service, 2021: A decade after the Fukushima accident: Radiation-linked increases in cancer rates not expected to be seen[53]. Waddington et al., 2017: J-value assessment of relocation measures following the nuclear power plant accidents at Chernobyl and Fukushima Daiichi[54]. Ishikawa et al., 2015: The Fukushima Health Management Survey: estimation of external doses to residents in Fukushima Prefecture[55]. Siegel et al., 2017: Subjecting Radiologic Imaging to the Linear No-Threshold Hypothesis: A Non-Sequitur of Non-Trivial Proportion[56]. World Nuclear Association, 2020: Naturally-Occurring Radioactive Materials (NORM)[57]. Geological Survey of Denmark and Greenland (GEUS), 2022: Denmark’s subsoil evaluated for radioactive waste disposal[58]. DW, 2022: Finns embrace nuclear waste[59]. What is nuclear, 2022: What is nuclear waste?[60]. Department of Energy, 2022: 5 Fast Facts about Spent Nuclear Fuel[61]. World Nuclear Association, 2022: Nuclear Power in FranceFollowing our comments on the open debate from the researchers behind the memo “Facts about Nuclear Power,” here are our comments. We hope the researchers find our comments useful for a more fact-based and transparent debate.
On Thursday, 20 October, a paper entitled “Facts about nuclear power in Denmark – Input to a fact-based discussion of the advantages and disadvantages of nuclear power as part of the green transition in Denmark” was published. A group of 16 Danish researchers from five universities are signatories to the memo.
The association Atomkraft Ja Tak welcomes the note in the debate. It is fantastic that we are now debating nuclear power. It is also gratifying that the researchers have openly sought input to prepare version 2.0 of the memo. We in the Association for Nuclear Power Yes Tak have plenty of them, which we will review in this write. However, it is particularly relevant that the next version of the memo includes the Danish researchers who know the most about nuclear power and who, remarkably, have not been involved in this version. Foreign experts from Sweden, for example, where nuclear power is facing a significant expansion in the coming years, should also be affected.
The Danish researcher Bent Lauritzen, head of a section for Radiation Physics at DTU, has been highly critical of the memo to the media “Ingeniøren.” His reaction includes:
“They seem to have not understood the technology. I don’t want to assess whether you should have nuclear power in Denmark, but you should at least investigate it seriously, and I don’t think this is.” [1]
It is important to point out that only some researchers behind the memo are trained with a specialty or additional competence profile in implementing nuclear power. We find, among others, Henrik Lund among the researchers known for his past in the anti-nuclear movement OOA, which organized nuclear marches in the 70s and 80s. Henrik Lund is also one of the central figures behind the energy system model used in the memo. Henrik Lund told DR a few years ago:
For me, nuclear power is not a dream. It’s a nightmare. My dream is renewable energy.” [2].
While the researchers do not appear to have educational competence in implementing nuclear power in energy systems, their area of competence is primarily 100% renewable energy systems, in which nuclear power is not included. It is therefore important to bear in mind that the researchers behind the report do not necessarily have sufficient expertise to make an adequate “Input to the debate on nuclear power.”
In the foreword to the note, the researchers write: However, it is difficult to directly compare solar, wind, and nuclear power. This formulation creates an expectation that researchers will try to make the best basis for comparison between the energy sources. However, this turns out not to be the case.
In the first and primary section of the memo entitled “Costs and construction times for nuclear power in Denmark,” they compare three selected nuclear power plants with three wind farms and one solar park in Denmark. Such a one-to-one comparison between price and construction time for solar/wind and nuclear power is not meaningful for many reasons, which we will review.
In the second section of the paper, “Energy systems,” the researchers then try to consider the lack of a basis for comparison in the first section by incorporating nuclear power into one selected model from IDA’s climate response 2045. However, the input used in this section comes from the first part of the note.
Foreningen Atomkraft Ja Tak wrote the present post. We are a cross-party grassroots movement that wants to contribute to a factual and informed debate on nuclear power as part of the solution to society’s energy and climate challenge.
Although the name might suggest otherwise, the association wants a technology-neutral approach to the energy and climate challenges, and we are thus not against the expansion of either wind turbines or solar cells. However, we do not think the general public debate on nuclear power is an expression of a technology-neutral approach to the energy source. This is also evident in the memo, which lacks so many nuances that it actually expresses the opposite of the input to a fact-based debate on nuclear power in Denmark that the researchers say they want to bring.
For clarifications or other inquiries, please contact Johan Christian Sollid, chairman of the Atomic Energy Association Yes Please.
Johansollid@atomjatak.dk
Table of contents
Key points
Introduction
1. Costs and construction times of nuclear power in Denmark
1.1 Electricity generation costs
1.3 Support needs for investment in nuclear and renewable energy
1.4 Nuclear power as peak and reserve load
3.1 Where in Denmark should such nuclear power plants be located
3.3 How radioactive waste is managed and where should it be deposited
Key points:
- The researchers behind the paper select three of the most expensive and delayed nuclear power projects to represent European nuclear power. The researchers failed to address why the projects were so expensive and delayed.
- The absence of nuclear power plants in other countries (Japan or South Korea) is not explained.
- According to the International Energy Agency, the price of both wind and solar energy has risen over the past few years, especially due to the rising raw material prices, which have a major impact on the construction price of material-intensive energy sources such as wind and solar energy.
- The researchers believe that we cannot compare with nuclear power in China due to other working conditions, but do not seem to relate to the fact that 1/5 of all solar cells installed in Denmark can be traced back to slave labor in the Chinese province of Xinjiang.
- The researchers do not address whether nuclear power can supply district heating in a Danish context or cost reductions in connection with the establishment of already existing CHP plants.
- A direct comparison between controllable (nuclear) and non-controllable (wind and solar) energy sources is misleading. International Energy advises against such a comparison, as non-controllable energy introduces several systemic costs that are not equally associated with controllable energy sources.
- Misleading comparison of construction time. The researchers compare b.la., a small onshore wind farm, with a large nuclear power plant in England, which produces 150 times more electricity per year than the wind farm. Here, the researchers should consider the capacity factor and the installed capacity at the plants.
- The researchers misrepresent the planning time of wind farms in Denmark by not including previous studies and consultations in their estimates. In the case of nuclear power, the planning times are considerably more accurate.
- The researchers’ systems analysis is based on objectionable assumptions about the investment costs of nuclear power. The underlying assumptions of IDA’s climate response 2045 have also been included, based on ambitious assumptions for a future energy system.
- The researchers touch on the remaining questions regarding safety risk and waste management. Here we find the researchers’ criticisms incredibly unnuanced and lacking documentation.
Introduction
Initially, it is essential to clarify that scientists make some significant mistakes that make their later conclusion, that nuclear power is far too expensive and slow in a Danish context misleading. To compare the price and construction time of energy sources, the researchers select three of the most costly and delayed nuclear power plants in world history: Olkiluoto 3 in Finland, Flamanville 3 in France, and Hinkley Point C in the United Kingdom, thus defining these as representative of nuclear technology. The researchers failed to address why the projects were so expensive and delayed. The reason is that the countries opted for an untested reactor design that was not even fully designed when construction began. However, the vast majority of nuclear power plants in the world, including those built in the last 20 years, have been built at competitive prices and much faster than the three selected nuclear power plants.
The researchers compare the price and construction time of the three above-mentioned nuclear power plants one-to-one with the price and construction time of the last two Danish offshore wind farms, an onshore wind farm and a solar farm, without taking into account that the nuclear power plants and the weather-based energy sources supply two very different products in the form respectively. Controllable and fluctuating energy production. Since energy sources provide two other products, it is not accurate to compare their price and construction time one-to-one.
The memo paints a picture of nuclear power being far too expensive in a Danish context. One may therefore wonder why our neighboring countries, Sweden and the Netherlands, with whom we often compare ourselves and which have access to the same data basis, have plans to expand nuclear power in conjunction with an expansion of wind and solar.
1- Costs and construction times of nuclear power in Denmark
It quickly becomes clear that the researchers intend to compare the only three nuclear power plants built in Europe in the last 15 years with offshore wind and solar energy expansion. The 60 other reactors that have been built around the world during the same period are left out by the researchers. Why don’t they compare with reactors constructed in South Korea, Japan, or the UAE? It is not self-evident to compare exclusively with the works built in European countries over the last two decades.
The researchers defend this choice because nuclear power plants in China and India do not face the exact safety requirements as in Western Europe, but they fail to demonstrate evidence for this assumption. The fact is that some of the Chinese nuclear power plants are built by the French company EDF in an entirely identical reactor design. How scientists arrive at the opposite is nowhere to be seen. Although they refer to a source, it states:
“While significant cultural, social, and political differences may exist between countries, the fundamental basis for assessing the safety of nuclear reactors is fairly uniform among countries with established nuclear power programs.” [3]
It is also noteworthy that in their selection of the three European reactors mentioned, the researchers only address the opt-out of reactors in China and India. Over the last 20 years, nuclear power plants have also been built in Japan and South Korea, which are pretty comparable to European countries. Both countries are prosperous, high-tech, and democratic countries considered part of the West. We find no further explanation for excluding these countries in the relevant note. Both countries have recently announced that they will invest in nuclear power as a significant part of their green transition.
Price trends
Contrary to the researchers’ skepticism about future costs for nuclear power, they are pretty uncritical about how costs for wind and solar energy will develop. They insinuate that prices will probably continue to fall because wind and solar costs have fallen in recent decades. Of course, it would be good if this happened, but one must be careful with such assumptions, and several factors indicate that it is challenging to push prices further down.
On the contrary, according to the International Energy Agency, the price of both wind and solar energy has risen in the last few years [4], mainly due to the rising raw material prices, which have a major impact on the construction price of material-intensive energy sources such as wind and solar Energy.
There have been calls from the wind industry [5] that profits are under pressure [6] and that parts of the supply chain are threatened with survival [7]. Vestas and Siemens Gamesa have laid off hundreds of employees this year alone, including in Denmark [8].
However, the most crucial criticism regarding the researchers’ expectations of the price of renewable Energy is that they do not address the fact that a very significant reason for the hefty price drop of the last two decades, especially for solar cells [9], is that a very substantial reason for the big price drop of the previous two decades, especially for solar cells [9], has been China’s massive entry into the production of the required raw materials and components.
Chinese production takes place in many cases under deeply objectionable conditions that we would never accept in the West and are now increasingly being problematized politically [10]. In short, the low production price for solar cells has been possible due to the use of cheap Chinese coal for energy-intensive solar cell production, and not least by using ultra-cheap forced labor from the Muslim minority in China. As much as 45% of the world’s production of the main component polysilicon of solar cells is produced in these labor camps [11].
If we look at solar parks set up in Denmark, TV2, and Danwatch revealed in July that up to 1/5 of all Danish solar cells have components that can be traced back to forced labor in China. The solar park Heartland, which is the solar park the researchers have selected to compare prices with nuclear power, has been built by the solar company Better Energy. TV2 writes the following about the solar park Heartland:
“The cells in the wind farm were supplied by a Chinese solar cell manufacturer Risen Energy, which has subcontractors in Xinjiang who use the Chinese work programs. The solar company, Better Energy, has built the park.” [12].
We, therefore, find it extremely strange that scientists write that we cannot compare with nuclear power plants built in China because “… they are based on different construction and safety requirements than those in Western Europe.” But when it comes to Danish solar parks, are similar considerations not included?
If it is politically decided to do something about the above problems, it will undoubtedly be quite a challenge to live up to the expectation that even cheaper solar cells will be produced in the future. The solar industry has also tried to pressure the EU to limit possible strict legislation against the purchase of goods produced by forced labor.
The European trade association, Solar Power Europe, is skeptical that such a political decision can be implemented. The following is an excerpt from an article on Danwatch:
“As a justification, Solar Power Europe emphasizes, among other things, that the import ban must not impose an excessive administrative burden on companies and that “the EU is currently completely dependent” on imports from China and Southeast Asia in its efforts to implement the green transition” [13].
It is not only nuances regarding the price of renewable energy that needs to be added to the memo. There needs to be more nuance to the cost of nuclear power, which we will now touch. The researchers do not include opportunities to improve the economy of nuclear power stations.
Cheaper reactor types than EPR
Firstly, there is no mention of the possibility of choosing suppliers and reactor types other than the French/German-designed EPR reactor supplied by the French EDF. This would otherwise be a very relevant consideration, given that the first three in Europe are not going well and that there are cheaper alternatives on the global market.
In Poland, the government has just concluded agreements with two other companies, the American company Westinghouse and the South Korean company “Korea Hydro & Nuclear Power,” for these companies to build nuclear power plants in Poland [14]. Poland also received offers from French EDF, which, however, would reportedly be over 50% as expensive a choice for Poles as the Korean model [15].
This is only regarding choosing a classic large, conventional nuclear power plant. We will later consider the possibility of investing in so-called small modular reactors.
First-of-a-kind (FOAK)
It is known in the literature that specialization gains from building several units of the same reactor type contribute to pushing down the price. The type of reactor built in Finland, England, and France can be described as the First of a kind (FOAK). The International Energy Agency (IEA) points out in their latest price report that significant gains will be made by continuing to build the same reactor type several times, also called Nth of a kind (NOAK) [16].
Illustrated in the figure above, we see eight steps from a FOAK to a NOAK reactor. The biggest reductions are seen in the first four steps: Design Maturity (1), Effective Project Management (2), Regulation Stability and Predictability (3), and Multi-Unit and Series Effects (4). The French EPR reactor is about to complete these four steps, and the researchers compare them. This means that we can expect reductions in the price of the reactor in future projects.
- The design of the reactor has matured
- Project management has been improved,
- Legal regulation has become more streamlined
- More units have now been built.
All steps mean that future reactors have visible price reductions in sight.
District heating
The researchers need to include the possibility of using the heat at the nuclear power plant to supply the Danes with district heating. Using the nuclear power plant for electricity and district heating in Denmark is quite apparent, as 2/3 of our heat consumption is supplied by district heating.
The efficiency of a nuclear power plant, the part of the total amount of energy that is useful and not wasted, is set in the note at 33%. This is classic for those nuclear power stations that produce only electricity. This is because there is an energy loss in all kinds of power plants, where fuel is used to heat water to drive steam turbines. Unlike burning coal, oil, biomass, and gas, however, using nuclear energy to make steam does not emit either CO2 or particle pollution.
In Denmark, we have a tradition of being masters at avoiding such energy loss by co-producing at our CHP plants. As the name suggests, these plants produce both electricity and district heating. In this way, the plants achieve significantly higher efficiency than 33%.
The Danish Energy Agency’s report from 2015 expects an efficiency of around 90% for Danish CHP plants [17]. Nuclear power plants could also achieve efficiency of the same magnitude [18].
Replace existing coal and biomass power plants.
Furthermore, the researchers must consider possible savings by building nuclear power on existing coal or biomass power plants. Since large parts of a nuclear power plant are entirely similar to other combined heat and power plants, this can save several components. The U.S. Department of Energy (DOE) estimates that 80% of U.S. coal-fired power plants can be converted to nuclear power plants, and they estimate that the savings from doing so are between 15 and 35% [19].
Denmark has a good handful of CHP plants close to the sea, with transmission stations, electricity cables, and district heating pipes. These sites are apparent to use for nuclear power stations or explore the possibility of doing so. The plants will not need large cooling towers, as they would use seawater as cooling water like the existing Danish power plants.
In summary, the researchers need to address many considerations regarding the prices of energy sources in their paper. From here, it is a recommendation to nuance the analysis significantly more.
Electricity generation costs
The researchers conclude that nuclear power is twice as expensive as offshore wind by comparing the last two offshore wind farms in Denmark, one onshore wind farm and one solar farm, Horns Rev 3, Kriegers Flak, Wind Farm Thorup-Sletten, and Heartland, respectively, with three of the most expensive nuclear power plants in world history. Olkiluoto 3, Hinkley Point C and Flamanville 3. The researchers write the following about the price comparison between nuclear power and weather-dependent energy sources:
Figure 1 also shows the opportunities that we need to have in Denmark. Here we can see that offshore wind farms in Denmark are still about the same price as nuclear power in China, just as onshore wind farms or solar farms are about the same price as lifetime extension – if it requires an investment in the plant. Based on this data, there is nothing to suggest that nuclear power investments in Denmark provide better economics than investments in renewable energy.
Source: Zinck et al., 2022: Facts about Nuclear Power in Denmark International Energy Agency (IEA) Furthermore, the researchers support their price calculations in Figure 1 with figures from the International Energy Agency (IEA). They write that the figures from the IEA show the same pattern as the calculations in Figure 1. In section 4.3.3, the researchers note that the statistics for Nuclear Power in Europe in 2050 are constructed by taking figures from two different IEA reports. The specific costs (capital costs) come from the World Energy Model: Techno-economic inputs. Report 2021 and Operation and maintenance originate from the levelised cost of electricity calculator 2020. For capital costs, they set a fee of €4500/kW; for Operation and maintenance, it is €14.26/MWh for nuclear power in Europe in 2050. The Operation and maintenance price comes from the IEA’s LCOE-Calculator. The only project in this overview with an operating cost of 14.26 is the Gen III project (1650 MW) in France. This operating cost applies to nuclear power in France in 2020 and says nothing about the cost of Operation and maintenance at nuclear power plants in Europe in 2050. This leads us to the general criticism that it is strange to include figures from 2050 at all. Projections on the cost of different energy technologies 28 years into the future are pure guesswork. Especially when we look through the statistics for offshore wind, onshore wind, and solar energy in the Danish energy catalog used by the researchers, we see large price drops in the next ten years. It is therefore assumed that similar price declines we have seen with solar, onshore, and offshore wind over the past several years will continue. As mentioned, the International Energy Agency shows that the prices of raw materials used to produce weather-dependent energy sources are rising. This will most likely result in a less pronounced fall in prices than previously expected |
Incomparable
The first impression is that it makes no sense to compare the price of nuclear power with weather-based energy, as they are two different products. The International Energy Agency (IEA) writes in its latest price report that it needs to be more accurate to compare the price of controllable energy sources (nuclear) with the cost of weather-dependent energy sources (wind and solar energy) [20].
It is, therefore, not only reprehensible that the researchers use a small sample for the comparison but also that, on the basis of a one-to-one comparison between nuclear power and weather-dependent energy sources, they conclude that it is not worthwhile. It is against scientific practice and methods in the field. Therefore, the first part of the report, in which researchers compare nuclear power exclusively one-to-one with weather-dependent energy, is superfluous.
It is misleading to compare the price of controllable power from nuclear power with fluctuating power from wind and solar, as production from weather-dependent energy sources follows the weather and therefore does not necessarily match society’s demand for power. Thus, the value of the power produced by weather-dependent energy sources is significantly less for the energy system than the value of reliable power from nuclear power. The instability of weather-based power generation requires backup energy sources to be ready in the wings to take over.
Controllable energy sources such as nuclear power and hydropower also require a degree of backup, as there are, among other things, periods when the nuclear power plant needs new fuel or maintenance. However, the required amount of backup is on a completely different scale than when establishing wind and solar energy because, with solar and wind energy, you must constantly have the backup capacity to be ready.
The rapid change in production from weather-dependent energy sources must be balanced, which is not required by controllable nuclear power. Conversely, nuclear power can create this balance since it is a controllable energy source.
The researchers claim that nuclear power is not suitable for the same fast ramping as a gas turbine. However, this is not entirely true [21]. Indeed, many nuclear power plants are not designed for rapid regulation because it makes the best economic sense to run the plant at full throttle if a given electricity grid allows this. However, nuclear power plants can efficiently be designed to regulate power production quickly up and down. For example, the reactors of France and Germany can do this [22].
Thus, a nuclear reactor can go from generating 20% to 100% of its capacity in less than half an hour [23]. When one nuclear reactor does this, it is equivalent to “switching on” almost half of all Denmark’s offshore wind turbines in half an hour.
The establishment of nuclear power, therefore, requires far less backup than the establishment of wind and solar energy, where you can switch off power production quickly but where you cannot turn up more than the weather allows.
System costs
The need for backup is a negative externality in connection with establishing wind and solar energy, which increases as the share of weather-dependent energy sources in an energy system rises. A fair economic calculation, therefore, requires that these negative externalities be considered. The negative externalities are also called integration costs or system costs. When system costs are included, the calculation is called a System-LCoE (Levelized Cost of Electricity) rather than the classic LCoE that the researchers use.
The proportion of weather-dependent energy in a system is also called the penetration rate of the energy source. Research in this area shows a clear correlation between system costs and wind and solar energy penetration rates. System costs for weather-dependent energy sources increase as the share of energy sources grows.
In a peer-reviewed study published in 2013, System-LCoE is described for the first time [24]. The researchers explain that it is important to include system costs when calculating the price of weather-dependent energy sources. The system costs cover the profile, balance sheet, and grid costs, respectively. The figure below shows a clear pattern between the share of wind energy in the total system (penetration) and the system costs.
A concrete example is the recently announced additional cost of DKK 13.9 billion that electricity consumers in Denmark will have to pay for new transmission stations and transmission cables between Bornholm and Zealand in connection with the construction of a wind farm [25]. This will be referred to as an electricity grid cost, which in the figure below becomes exponentially greater the more wind is added to the energy system.
Source: Ueckerdt et al., 2013: System LCOE: What are the costs of variable renewables?
The above figure is from a paper published in 2013, which is why it is to be expected that the prices they desire are not representative of the price of wind energy today. The figure is used to illustrate how much system costs make up the total price.
It is difficult to determine whether the researchers include all the negative externalities in their energy system analysis. It is also difficult to expect all factors to be included, as system analysis is very complicated. We have previously directed criticism at precisely the system analysis that researchers use. We will discuss these criticisms in more detail in section 2.
1.2 Construction times
In the section of the memo on construction time, it is stated that to reach Denmark’s climate goal of a 70% reduction of greenhouse gases; we must focus on concrete projects that can be completed relatively quickly. In other words, a premise is being set up that we should only focus on technologies that can be achieved by 2030. We in Denmark do not want a completed nuclear power plant ready by 2030, but that is not a valid argument for why we should not invest in it. The artificial island to be built in the North Sea and the construction of an associated large wind farm will then also be irrelevant, as the first phase of the wind farm will not be ready for production until 2033, even though Energinet publicly presented the vision for this back in 2017 [26].
Before we consider the comparison between construction times on different energy sources that the researchers present in the paper, it is worth mentioning that they base the comparison on three nuclear power plants that are among the most delayed nuclear power plants ever, with construction times of 12, 16 and 17 years, respectively.
There are currently about 430 nuclear reactors in operation in the world. The median construction time for these is six years, which means that 50% are built in 6 years or faster [27]. For example, Barsebäck’s two reactors were built in just over four years. But it was in the 70s when you could make nuclear power quickly, you might think.
Yes, you could do that back then in Europe, but you can still do that around the world. Looking at the construction time in the world over the last 20 years, the median is seven years [28], as in many places, e.g., in Japan, South Korea, UAE, India, Russia, China, etc., nuclear power has been built relatively quickly. To single out only the three delayed nuclear power plants in Europe, all of which are even described as first-of-a-kind reactors, is, to say the least, to cherry-pick in facts.
When comparing construction times for energy technologies, it is essential to consider how much energy the respective energy technologies produce. It is difficult to compare the construction time of energy plants that supply widely different amounts of energy. Furthermore, it is essential to remember that 1 MW solar or wind capacity does NOT provide the same amount of energy as 1 MW nuclear capacity because energy sources have different capacity factors. In the sections below, we will demonstrate what the construction time looks like for the energy sources when we consider the size and capacity factor.
Accurate comparison between energy technologies
We described in section 1.1 that the International Energy Agency (IEA) advises against comparing the price of weather-dependent energy sources with controllable energy sources, which is why this also applies to the construction time.
Nevertheless, the researchers do so in the memo. In Figure 3, the researchers calculate the construction time of three nuclear power plants, two offshore wind farms, one onshore wind farm, and one solar farm, respectively, showing that the nuclear power plants take significantly longer. However, the researchers do not consider the size difference between the capacities of the energy plants. They also ignore the fact that there are differences in how often the different energy sources can supply up to their maximum capacity.
For example, they compare a small North Jutland wind farm with 18 wind turbines with an installed capacity of 77.4 MW with the prominent British nuclear power plant Hinkley Point C of 3200 MW. It’s like comparing a truck to a bicycle. Of course, it takes longer to build a truck than a bicycle, but the truck can transport significantly more than a bicycle.
The problem arises when we examine what the different plants produce regarding energy. For the three nuclear power plants, this is 3200 MW capacity for Hinkley Point C, 1600 MW for Olkiluoto 3, and 1600 MW for Flamanville 3. All three plants are expected to have a capacity factor of around 90%. By taking into account the annual production from the different plants, we can calculate how much TWh the different energy sources add each year with the formula:
MW x 24 hours x 365 days x 90% = TWh/year
Using the above formula, we get 25 TWh/year for Hinkley Point C and 12 TWh/year for Hinkley Point C, and 12 TWh/year for Hinkley Point C, respectively. Olkiluoto 3 and Flamanville 3.
Horns Rev 3 has a capacity of 407 MW, Kriegers Flak of 604 MW, onshore wind farm Thorup-Sletten of 77.4 MW, and Heartland solar farm of 207 MW. At first glance, there are very different sizes of nuclear power and energy plants with renewable energy. Of course, wind and solar farms are faster to build when they are significantly smaller.
In addition, it is important to remember that the capacity factor for offshore wind, onshore wind, and solar cells is also significantly lower than for nuclear power. Vattenfall expects a capacity factor of around 52% for offshore wind for Horns Rev 3 and Kriegers Flak. For Thorup-Sletten onshore wind farm, the capacity factor is about 25%. However, the Danish Energy Agency’s technology catalog states that the capacity factor for onshore wind in Denmark in 2020 is 38%, but Energinet’s production figures for Thorup-Sletten in 2021 show a capacity factor of 25% [29]. It was impossible to find the specific capacity factor for the solar park Heartland, so we instead used the Danish Energy Agency’s capacity factor for solar cells in Denmark of 14%.
With the same formula, this gives 2.7 TWh/year for Horns rev 3, 1.8 TWh/year for Krigers Flak, 0.17 TWh/year for Thorup-Slette, and 0.254 TWh/year for Heartland.
If the 25 TWh nuclear power plant Hinkley Point C is compared with the 2.7 TWh offshore wind farm Horns Rev 3, it takes (25/2.7) = 9 times Horns Rev 3 to get the same amount of energy production in one year as Hinkley Point C. Furthermore, it is essential to remember that the energy from Hinkley Point C is controllable, while the power from Horns Rev 3 comes in clumps at unpredictable times.
Below we see an overview of the different plants and their respective capacity, capacity factor, construction time, annual production, and production in relation to the construction time.
| Anlæg | Installeret kapacitet | Kapacitets-faktor | Byggetid | Årlig produktion | Produktion / år |
| Hinkley Point C | 3200 MW | 90% | 12 år | 25,23 TWh | 2,10 TWh |
| Olkiluoto 3 | 1600 MW | 90% | 17 år | 12,61 TWh | 0,74 TWh |
| Flamanville | 1600 MW | 90% | 16 år | 12,61 TWh | 0,79 TWh |
| Krigers Flak | 407 MW | 52% | 3 år | 1,85 TWh | 0,62 TWh |
| Horns Rev 3 | 604 MW | 52% | 2 år | 2,75 TWh | 1,38 TWh |
| Thorup-Sletten | 77,4 MW | 25% | 2 år | 0,17 TWh | 0,09 TWh |
| Heartland | 207 MW | 14% | 1 år | 0,25 TWh | 0,25 TWh |
So there is a clear picture that when we only look at the construction time without considering capacity and capacity factors, it seems that nuclear power plants take far too many years to build, and weather-dependent energy sources can be built in a snap. However, this is only half the truth since the plant sizes of the weather-dependent energy sources are considerably smaller, and their capacity factor is also significantly lower.
The fact that the researchers behind the note do not relate to this is extremely problematic, as it is highly unnuanced to present data as they do in Figure 3.
Planning time
The researchers note that planning time is critical and difficult to calculate or predict. In addition, the researchers present that the planning time for Olkiluoto 3 was five years, and eight years for Hinkley Point C. In continuation, they give the planning times for Horns Rev 3 and Krigers Flak to be between 3-6 years, as they were both part of a political agreement in 2012.
However, the planning times for Horns Rev 3 and Krigers Flak, respectively, could be more accurate. The researchers are correct that Krigers Flak was part of the Folketing’s energy agreement in 2012, but that is only a half-truth.
We have to go further back to find the origins of Krigers Flak. In 1996, the then government’s plan for sustainable energy development called Energy Plan21 was published. Here, Denmark’s future energy system was planned, and it was decided to develop the Offshore Wind Action Plan, which was published in 1997. In it, it was decided to expand Danish offshore wind by 4000 MW by 2030 [30].
An article in Ingeniøren from 2003 states that Krigers Flak, along with ten other sites, was already identified in the 1997 Offshore Wind Action Plan and that screening from 2003 narrowed the area down to four locations, of which Krigers Flak was one of them [31]. It is then stated in a report by the Danish Energy Agency that screening of the area at Krigers Flak has been carried out for EIA approval and the establishment of an offshore wind farm [32].
In 2005, the Danish Energy Agency, Energinet, the Danish Maritime Authority, the Danish Nature Agency, and DTU Risø established the Offshore Wind Committee. In a report by the Danish Energy Agency from 2008, Offshore Wind Action Plan, proceeding with the project Krigers Flak is also recommended. They estimate that it will not be completed by 2012, but some work has already been done on the planning of the park [33].
Therefore, it needs to be corrected that Krigers Flak only had a planning time of 6 years (2012-2018). The planning of the park already took place in 1997, which is a planning time of 21 years (1997-2018). The total construction time of Krigers Flak can therefore be assumed to be up to 24 years (1997-2021).
It is a general trend that offshore wind farms in Denmark have significantly longer planning times than those described in the memo. The map below can be found in the report Future Offshore Wind Locations – 2025 from 2007, and it shows many of the areas we are working to establish offshore wind turbines towards 2030 [34].
In the Energy Agreement 2012, which included Kriegers Flak and Horns Rev III, it was also decided that 500 MW of coastal offshore wind turbines should be built. This was later narrowed down to a 350MW offshore wind farm, Vesterhav Syd and Nord, and was originally due to be completed in 2020, but due to delays, the goal is now for it to be ready by the end of 2023, 11 years after adoption [35].
The same applies to two offshore wind farms adopted in the Energy Agreement 2018, located at Hesselø and Bornholm. At Hesselø, the preliminary studies showed that the chosen location was unsuitable for the construction of the turbines, and new studies are now underway to determine a spot to place them. This has delayed the project, and the new goal is now for the park to be completed by the end of 2029 at the latest, which is two years later than the original plan, and almost 12 years after the agreement was made [36].
Energiø Bornholm, a further development of the wind farm that, together with Thor and Hesselø, was decided in 2018, is also planned to be completed in 2030, 12 years after it was adopted [37]. The area for the location of the turbines can also be found in the Danish Energy Agency’s report Future offshore wind turbine locations – 2025 from 2007, so it is a project that has been underway for a long time (Can be seen in the map above).
These wind turbine projects, among others, constitute a significant part of the Danish expansion of offshore wind turbines and are thus outside the external limits of the memorandum for establishing wind and solar, with a planning time of 6 years and construction time of 3 years. To present a planning time for wind turbine projects of 1-6 years is quite misleading, as many of the larger projects in recent times have proven to take significantly longer.
For the Olkiluoto 3 nuclear power plant, scientists assume a planning time of about five years. The application for the plant was submitted in 2000 and later approved by the Finnish government in 2005. We have searched for evidence that the planning time should be longer, but we cannot find any evidence that the planning of Olkiluoto 3 should have taken place before the year 2000.
Similarly, for Hinkley Point C, we find no evidence that the researchers’ assumptions about planning time from 2008 to 2016 are wrong.
Overall, we note that the planning times for the Danish wind turbine projects are highly misleading. Scientists set a planning time for nuclear power of 5 to 8 years, which we do not dispute. This is assumed to be 1-6 years for wind and solar, but based on our above presentation, it turns out that a number of wind turbine projects in Denmark have been underway for almost two decades.
Of course, the above planning and construction times for both wind farms and nuclear power plants will only sometimes apply in the future. We welcome that politicians are talking about reducing the time-consuming and bureaucratic processes for planning and approving wind turbines and nuclear power plants.
1.3 Support needs for investment in nuclear and renewable energy
The researchers compare the need for state support between the wind as mentioned above turbine projects, Horns Rev 3 and Krigers Flak, as well as the recently decided wind farm “Thor,” which does not receive state aid, with the state support for the world’s most expensive nuclear power plant Hinkley Point C. In doing so, they insinuate that support for these projects will represent future projects.
Firstly, it is a meaningless comparison. Society gains greater value by supporting a controllable energy source that better supports the security of supply and puts less strain on our planet’s resources and area, according to the latest UN Life Cycle Report on Energy Sources [38]. Therefore, DKK 100 state aid for nuclear power provides higher value to society than DKK 100 state aid for wind.
Secondly, the researchers again miss the point that the more fluctuating energy there is in an energy system, the higher the marginal cost of adding more fluctuating energy. Therefore, all other things being equal, the need for state aid will increase to add more wind and solar power.
It cannot, therefore, be assumed, as the researchers do, that this will continue to be the case because we do not currently give individual wind projects state aid. Or assume that because a first-of-a-kind nuclear power plant in Britain was expensive to support, that will continue to be the case.
In the UK, lessons have been learned, and a smarter investment model has been found to give investors certainty in building the next nuclear power station, Sizewell C. The model will lower the investment rate and thus the price significantly, as the investment rate is by far the largest cost associated with building a nuclear power plant borrowing costs amounted to as much as 2/3 of the price of Hinkley Point C [39]. The new financing model is expected to result in total savings of £30 billion for electricity consumers, not investors, over the plant’s lifetime [40].
1.4 Nuclear power as peak and reserve load
The researchers are critical of whether nuclear power can act as peak and reserve load. We have previously described in the note that it is not true that nuclear power cannot regulate its electricity production quickly up and down, although it does make the most economic sense for the nuclear power plant itself to run as often as possible.
In the researchers’ study of what the price is for having nuclear power as a backup, it is assumed that the nuclear power plant should ONLY stand as a backup for wind and solar and thus have no independent production for the electricity grid. Thus, it is not calculated whether there is a socio-economic gain from giving nuclear power plants a certain fixed amount of energy production, i.e., also during periods when the wind blows, and the sun shines, as a kind of financial compensation from the wind turbines and solar cells so that the nuclear power plants in return can deliver during periods without wind and sun.
Nor is it calculated in a scenario where the nuclear power plants are used for district heating production and power-to-x production, respectively, in cases where wind turbines and solar cells can cover the power demand themselves. Like any other industrial plant, a power-to-x plant wants to capitalize on its capital costs by producing as much as possible. It is conceivable that the nuclear power station can make a better contribution to this through its continuous production. The nuclear power plant must then be connected to the electricity grid when there is not enough wind and solar energy.
Nor is it calculated on the value of Denmark being able to improve its security of supply rather than being fully dependent on our neighboring countries. In Norway, there is an emerging political discussion about whether the electricity supply to the rest of Europe should be shut off during critical periods because the European electricity market also drives prices high in Norway, even though they can produce cheap electricity with hydropower. Of course, we hope this does not happen, but it illustrates that leaving one’s security of supply to other countries always comes with risks.
In the scenario calculated by the researchers, it is assumed that a nuclear power plant will only operate 1000 hours per year, which corresponds to a capacity factor of 11.4%. This means that according to the researchers’ calculations, Denmark only requires to be covered 11.4% of the time by stable energy sources, while everything else can be done with wind, solar, PtX, and imports from abroad. This is a very optimistic assumption that is not further documented by the researchers. Instead, they refer to IDA’s climate response 2045, which the Danish Atomic Energy Association Ja Tak has already criticized in an interview with Ingeniøren [41]. We certainly do not believe that IDA’s climate response can be used as a bible within energy system models.
Green biogas?
In the researchers’ scenario regarding reserve and peak loads, nuclear power is compared to biogas, which the researchers call “green gas.” Whether biogas can be called “green” is a great discussion. Biogas is made mainly from waste products from animal production. Animal production is challenged by experts for various environmental and climate reasons, which society should have less of in the future. Energy recovery is also at the bottom of the resource pyramid, which defines the value of utilizing biological waste resources [42]. Therefore, when resources are allocated to biogas energy production, it often means that the production of other goods that could have used the same waste resources must use an increased amount of virgin resources, often with relatively more significant CO2 emissions as a result overall.
Then there is the problem of leaks of the potent greenhouse gas methane from biogas plants. A recent report to the Danish Energy Agency showed that 69 of the country’s 144 biogas plants had an average methane loss of 2.5%. As many as 38 percent of biogas plants are above the 6% leakage limit, which, according to researchers from Aarhus University, indicates that a biogas plant has a negative climate effect seen over 20 years [43].
It should therefore be questioned whether we as a society should make our energy supply dependent on biogas, which depends on waste products, of which organization will have less in the future, and where energy efficiency is the worst possible use of resources.
The point is not that we should not have biogas at all, which is, of course, significantly preferable to natural gas. The fact is that it is an unequal comparison from a purely climate and environmental perspective to compare biogas with nuclear power. According to the latest UN report, nuclear power is the energy source with the minor CO2 emissions and, at the same time, the energy source that requires the fewest raw materials and space from nature over the life cycle of energy sources [44].
1.5 Small modular reactors
Small modular reactors include several reactor types under development in many countries. Here in Denmark alone, we have two companies in the field; Seaborg Technologies and Copenhagen Atomics. The researchers conclude quickly that small modular reactors are not suitable for Denmark.
However, the researchers assume that all types of small modular reactors fall under one umbrella regarding maturity, price, and speed, which is highly questionable. To be a relevant input, one should investigate both the possibilities of the conventional light-water reactors on a smaller scale from companies such as Rolls Royce, NuScale, and GE Hitachi, as well as the options of the so-called 4th generation nuclear power, where molten salt reactors belong, among others. Both types are a maximum of 300 MW reactors (classical reactors are over 1000 MW) and therefore fall under the collective term “small modular reactors.” However, there are significant differences in how marketable they are.
4th generation nuclear power is developing rapidly, and there are huge perspectives, but there is still some uncertainty about how quickly they can get design approvals. In many cases, the other small modular reactors can already be ordered today, as they have just been done in Canada, where they expect the reactors to be operational by 2030 [45]. This type of nuclear power is, among other things, what the Swedes will now implement plans to expand in the coming years.
The researchers refer to one study about the price for small modular reactors is not competitive and accept this conclusion without nuance. Here’s the finding from another study:
“These comparisons illustrate that design simplification, reduced componentry, modularity, and other features of the SMR design result in significant savings in overall base costs.” [46].
Last but not least, the researchers cite a personal statement from Seaborg CEO Troels Schönfeldt as a conclusion that nuclear power does not make sense in Denmark. It is not tenable, and frankly a little embarrassing, that scientists use anecdotal statements as evidence. Troels Schønfeldt’s statement was also criticized in an article in Altinget written by a Danish senior researcher in materials physics [47].
Energy system analysis
In the introduction, the researchers write that the energy system analysis is based on IDA’s climate response 2045. We have previously criticized this climate response in an article debate with Brian vad Mathiesen, where we pointed out that the climate answer assumes, among other things;
Denmark’s energy consumption towards 2030 will fall by as much as 30%; even though our energy consumption today has only marginally decreased compared to 30 years ago in 2045, Denmark will still burn wood and straw to get energy equivalent to 26.7 TWh that Denmark can import sufficient electricity from neighboring countries.
It is assumed that we can always import as much as the cables can pull – there is no modeling availability of fixed capacity abroad. Nor can anything be said about the price of import flows. In a European electricity grid in crisis, under pressure on marginal energy, the prices of imported back-up are sky-high.
The model used by the researchers in their energy system analysis needs to be revised since its assumptions are highly objectionable.
In addition, getting a better overview of whether all negative externalities of weather-dependent energy sources are included in the energy system analysis is essential. For example, it needs to be clarified whether the energy system model consists of expanding the electricity grid to a sufficient extent for connecting offshore wind. In IDA’s climate response 2045, the researchers write the following:
“Energinet and grid companies should prepare a grid connection rate for onshore wind and solar PV that reflects the marginal costs required for grid expansion. These can be high in areas with low electricity consumption and already high shares of renewable energy, but low or completely absent in areas with good electricity grids and high electricity consumption” [48].
The above wording gives a clear picture of whether all externalities to the electricity grid are included in the energy system model. We described in section 1.1 that system costs are growing exponentially in electricity grids, where the share of weather-dependent energy sources increases significantly. We are therefore concerned that the systems analysis used by researchers has not had this in mind.
On page 17 of the paper, the researchers write what assumptions lie behind including nuclear power in their energy system model. Firstly, they set the cost of capital on nuclear power at €6180/MW. They do this by taking the average money price from their calculations and the IEA’s projections for 2050. It seems odd since they use operating costs from 2020 from the IEA but not the capital costs from the IEA in 2020. These are significantly less than the average they construct. For France, according to the LCoE calculator, they are around €4000/MW [49].
We further find that the same biomass consumption occurs in calculations. This means that the researchers only compare the price when nuclear power replaces offshore wind, onshore wind, and solar energy, but not if it were to replace biomass. As described above, wood and straw will still be burned in 2045 in IDA’s climate response, corresponding to 26.7 TWh.
Furthermore, the researchers compare 1000 MW nuclear power with 1475 MW offshore wind or 2043 MW onshore wind. It is difficult to determine what capacity factor they’re counting on here. This capacity factor is approximately 75% for nuclear, 50% for offshore wind, and 35% for onshore wind. It was better formulated what capacity factor they use here. Section 4.3.1 shows their overview of operating hours, where onshore wind in 2020 is set at approximately 38% and offshore wind at 50%. However, these figures do not exactly match how much onshore wind, offshore wind, and solar cells are needed to replace nuclear power. This may be due to the inclusion of PtX capacity etc., but a more detailed description needs to be included.
In many parts of the world, nuclear power is operated with a +90% capacity factor. It cannot be ruled out that having such a high capacity factor in a Danish context is unrealistic, but it requires detailed, well-prepared justifications. It is also curious that the capacity factor for the wind farm that the researchers have chosen to highlight in section 1, Thorup Sletten, has a capacity factor of 25%. However, here it is assumed that the capacity factor for Danish onshore wind is in the region of 35%.
However, scientists should not only compare nuclear power with wind and solar but instead with biomass, coal, oil, and gas. The researchers do not comment on this. They mention that in IDA’s climate response 2045, 5 GW onshore wind, 14 GW offshore wind, and 10 GW solar cells have been installed in Denmark.
In the energy system model, 35.6 TWh per year is used for district heating, where a large part comes from biomass. Why not look at the possibility of nuclear power replacing this? They assume, as previously mentioned that nuclear power should only be used to produce electricity, thus achieving an efficiency of only 33%, as much of the heat is wasted.
How much efficiency nuclear power will achieve in a Danish energy system is difficult to predict. It will depend on how much of the thermal capacity from the plants is used for district heating and how much is used for electricity production.
A large nuclear reactor, such as an EPR, has a thermal capacity of 4500 MW. The reactor is expected to have an efficiency of 33% due to the immense heat waste used to generate the power. If half of the thermal energy of 2250 MW went to district heating, with the remaining 2250 MW of thermal energy, we could produce 743 MW of electrical power. The plant will produce 2993 MW of energy, giving an efficiency of 66.5%.
It thus provides twice as much efficiency by using half of the thermal energy for district heating. With the flexible operation, the production from the plant could be regulated according to the fluctuating heat consumption over the year so that district heating production from the plant is higher in the winter months and lower in the summer months. In the case of surplus electricity output, synthetic fuels or hydrogen can be produced by electrolysis.
There are thus several areas for improvement and criticisms in the researchers’ energy systems analysis, which we hope they will consider when preparing version 2.0 of their paper.
Remaining issues
3.1 Where in Denmark should such nuclear power plants be located
The researchers ask a hypothetical but relevant question, which obviously cannot be answered directly. A commission should be set up to designate suitable sites in Denmark for nuclear power plants. However, as previously mentioned, exploring the possibilities of using the infrastructure and location of the many combined heat and power plants we have in the country will be obvious.
3.2 Risk Placement
The researchers write that we must consider that an accident can happen, which will cost incredible sums of money. Here they draw attention to the Fukushima accident, in which a tsunami hit the east coast of Japan and destroyed a nuclear power plant. They compare the cost of this accident with a potential accident in Denmark, which is very reprehensible as we are not at risk of a tsunami in Denmark.
The accident was caused by the world’s 4th largest earthquake and a 13-15 meters high tidal wave, which destroyed three BWR reactors from the 60s, which cannot be compared to the generation of reactors we build today [50].
No nuances are given, and it is, therefore, between the lines that a hypothetical EPR reactor in Denmark could crash similarly.
The European Commission’s Joint Research Center writes in a section on the safety of energy sources that third-generation nuclear power is the safest way of all to generate electricity:
“These latest technology developments are reflected in the meager fatality rate for the Gen III EPR design. The fatality rates characterizing state-of-the-art Gen III NPPs are the lowest of all the electricity generation technologies” [51].
In the note, the researchers refer to the expensive clean-up in Fukushima prefecture after the accident, should things go wrong. However, they fail to acknowledge that the evacuation of thousands of people, with hindsight, was not justifiable from the point of view of health.
According to the United Nations Radiation Experts (UNSCEAR), the radiation release has not caused any sickness or death, and they do not expect this to happen in the future [52].
Recent research shows that no one should have been evacuated in Japan, as the evacuation was associated with significantly higher health costs, especially for the elderly and vulnerable, than the size of the radiation release [53].
The population received a very minimal radiation dose, so low that the amount for more than 99% of the evacuees corresponded to less than half the dose received from a regular CT scan of the spine in the hospital [54].
When we talk about radioactive radiation, the risk of harm to health is not about whether you are exposed to it but the dose. Fortunately for that, radiation exists everywhere in our world, so it’s good that the human body has evolved to be able to handle low amounts of radiation [55],
In many parts of the world, there is much higher natural background radiation than in Fukushima. If Europe had the same evacuation limit regarding the amount of accepted radiation, large parts would have to be evacuated [56].
The researchers fail entirely to address these facts. Fukushima is an example of political mismanagement during a crisis. This happens across a lot of societal challenges. Take, for example, the current corona management in China, where politically determined demands have imposed enormous costs on China relative to handling in the West.
3.3 How radioactive waste is managed and where should it be deposited
The researchers also pretend that we need to learn how to handle and where to store the nuclear waste, that is, the spent fuel. The researchers should otherwise be aware that as recently as January 2022, the Danish authority GEUS published a report in which they wrote that large areas in the Danish subsoil are expected to be well suited to deposit the waste 500 meters underground, isolated from the biosphere, which, however, requires further detailed studies.
GEUS’ report complies with IAEA guidelines for storage facilities for highly radioactive waste. Although Denmark no longer has high-level radioactive waste, only low- and medium-radioactive, the locations identified in GEUS’ report will thus also be suitable for the disposal of spent nuclear fuel, i.e., the highly radioactive waste [57].
We can learn from Finland’s or Sweden’s final depot projects. Finland’s is wholly completed and will be put into operation in a few years. The cost of the Finnish deposit is 0.01 kroner, i.e., 1 øre, per kWh (the first 30 years). Landfill costs are, therefore, peanuts in the economy of a nuclear power plant. Nothing prevents Denmark from creating a similar final depot.
It should be mentioned here that in Finland, there has been a struggle between municipalities to take responsibility for this final landfill because it creates jobs and wealth for the city [58]. The last Finnish depot Onkalo is today a tourist attraction.
Scientists should also know that waste has been handled safely and efficiently in all countries with nuclear power. Thus, no human being has ever been harmed or killed by civil nuclear waste [59]. For decades, the “garbage” we have been schooled in fear has never hurt anyone.
Nor is there any environmental damage, according to the report above by the EU’s Joint Research Centre JRC. The researchers are thus problematizing something that has been solved from a technical point of view. Shouldn’t we be more concerned about solving the world’s climate and environmental challenges rather than focusing on scare scenarios?
The question is whether it finally makes sense to landfill the waste. A significant reason why the world’s nuclear industry has yet to rush to the final landfill of garbage is that the spent fuel still contains 95% of the energy from the original fuel. Thus, nuclear waste has the potential to become extremely valuable. Many new fourth-generation nuclear reactors can use almost all the energy in nuclear waste for energy production, thus reducing the need for storage for final landfill.
Although all of America’s stored nuclear waste only takes up one football field at the height of ten meters [60], this nuclear waste can supply the United States for 2500 years using fourth-generation nuclear power, with the same amount of electricity as nuclear power generates in the United States today.
France already recycles its nuclear waste, meaning it derives 17% of its electricity from nuclear waste. They recycle through the so-called reprocessing of spent fuel, which is a significantly more expensive way to obtain fuel than simply buying new uranium, which is why few countries use this recycling today [61].
Sources
[1]. Ingeniøren, 2022 Researcher attacks memo on nuclear power in Denmark: 7 loose claims and factual errors[2]. DR, 2020: Shortly before groundbreaking: How Einar and Henrik stopped nuclear power in Denmark[3]. Massachusetts Institute of Technology (MIT), 2018: The Future of Nuclear Energy in a Carbon-Constrained World – An Interdisciplinary MIT Study[4]. International Energy Agency (IEA), 2021: What is the impact of increasing commodity and energy prices on solar PV, wind, and biofuels?[5]. Recharge, Global news and intelligence for the Energy Transition, 2022: ‘Offshore wind is fundamentally sick… no one’s making money’: ex-Ørsted technology chief[6]. Wood Machenzie, 2022: Wind industry faces a perfect storm of profit pressures[7]. Financial Post, 2022: Wind power’s colossal market failure’ threatens climate fight[8]. TV2, 2022: Wind turbine giant fires 800 in Denmark[9]. Scientific American, 2016: Why China is Dominating the Solar Industry[10]. TV2, 2022: See here if your solar panels are connected to forced labor[11]. Energyconnects, 2021: Why It’s So Hard for the Solar Industry to Quit Xinjiang[12] TV2, 2022: Solar cells in Denmark may be made with forced labor in China[13]. Danwatch, 2022: EU to ban import of goods produced with forced labour[14]. World Nuclear News, 2022: Poland’s Westinghouse choice ‘deepens strategic relationship’ with USA[15]. DW, 2022: US, South Korean firms to run Polish nuclear plants[16]. International Energy Agency, 2020: Projected Cost of Generating Electricity 2020 (Chapter 8.3 – pages 151-154)[17]. Danish Energy Agency, 2015: Background report E: Electricity and district heating[18] Powermag, 2022: District Heating Supply from Nuclear Power Plants: Technical and Economic Aspects[19]. Department of Energy, 2022: DOE Report Finds Hundreds of Retiring Coal Plant Sites Could Convert to Nuclear[20]. International Energy Agency, 2020: Projected Cost of Generating Electricity 2020 (page 18)[21]. Powermag, 2019: Flexible Operation of Nuclear Power Plants Ramps Up[22]. Korhonen, 2015: Graphic of the Week: Can nuclear plants load-follow?[23]. National Renewable Energy Laboratory (NREC), 2020: Flexible Nuclear Energy for Clean Energy Systems[24]. Ueckerdt et al., 2013: System LCOE: What are the costs of variable renewables?[25]. Finance, 2022: Denmark’s first energy island: Dan Jørgensen approves huge bill for beleaguered electricity customers[26]. Energywatch, 2019: New project to secure artificial energy island[27]. Energy Matters, 2016: How long does it take to build a nuclear power plant?[28]. World Nuclear Association, 2022: World Nuclear Performance Report, 2022[29]. Danish Energy Agency, 2022: Master data register for wind power plants[30]. Danish Energy Agency, 1996: Energy 21 – The Government’s Energy Action Plan 1996[31]. The Engineer, 2003: Four possible sites for new offshore wind farms[32]. Danish Energy Agency, 2004: Summary of consultation responses received in connection with the Danish Energy Agency’s screening of marine areas at Rødsand and Gedser in connection with tenders for offshore wind turbines[33]. Danish Energy Agency, 2008: Offshore Wind Action Plan 2008 – Follow-up to the mapping report “Future offshore wind turbine locations – 2025”[34]. Danish Energy Agency, 2007: Future offshore wind turbine location – 2025[35]. Danish Energy Agency, 2012: Agreement between the government (Social Democrats, Radical Left, Socialist People’s Party) and Venstre, Danish People’s Party, Red-Green Alliance, and Conservative People’s Party on Danish energy policy 2012-2020[36]. Energinet, 2022: Hesselø offshore wind farm[37]. Ministry of Finance, 2020: Climate Agreement for Energy and Industry etc. 2020[38]. UNECE, 2022: Carbon Neutrality in the UNECE Region: Integrated Life-cycle Assessment of Electricity Sources[39]. Medium, 2019: The Hinkley Point C case: is nuclear energy expensive?[40]. Department for Business, Energy & Industrial Strategy, 2021: New finance model to cut the cost of new nuclear power stations[41]. Ingeniøren, 2021: Debate: Should we have nuclear power in Denmark?[42]. Danish Technological Institute, 2018: The Danish opportunities for transition to a bioeconomy – what transition are we talking about?[43]. Ingeniøren, 2021: The Danish Council on Climate Change on biogas support: It is quite obvious to make counterclaims[44]. UNECE, 2022: Carbon Neutrality in the UNECE Region: Integrated Life-cycle Assessment of Electricity Sources[45]. Powermag, 2022: Canada Bank Group Pledges Millions Toward Nuclear Power Project[46]. Black et al., 2019: Economic viability of light water small modular nuclear reactors: General methodology and vendor data[47]. Althing, 2022: Physicist: Of course, it is relevant to discuss nuclear power in Denmark[48]. Lund et al., 2021: IDA’s Climate Response 2045: How to Become Climate Neutral (page 57)[49]. International Energy Agency (IEA), 2020: Projected Costs of Generating Electricity 2020 (page 49)[50]. World Nuclear Association, 2022: Fukushima: Background on Reactors[51]. Joint Research Center (JRC), 2021: Technical assessment of nuclear energy with respect to the ‘do no significant harm’ criteria of Regulation (EU) 2020/852 (‘Taxonomy Regulation’)[52]. United Nations Information Service, 2021: A decade after the Fukushima accident: Radiation-linked increases in cancer rates not expected to be seen[53]. Waddington et al., 2017: J-value assessment of relocation measures following the nuclear power plant accidents at Chernobyl and Fukushima Daiichi[54]. Ishikawa et al., 2015: The Fukushima Health Management Survey: estimation of external doses to residents in Fukushima Prefecture[55]. Siegel et al., 2017: Subjecting Radiologic Imaging to the Linear No-Threshold Hypothesis: A Non-Sequitur of Non-Trivial Proportion[56]. World Nuclear Association, 2020: Naturally-Occurring Radioactive Materials (NORM)[57]. Geological Survey of Denmark and Greenland (GEUS), 2022: Denmark’s subsoil evaluated for radioactive waste disposal[58]. DW, 2022: Finns embrace nuclear waste[59]. What is nuclear, 2022: What is nuclear waste?[60]. Department of Energy, 2022: 5 Fast Facts about Spent Nuclear Fuel[61]. World Nuclear Association, 2022: Nuclear Power in France